- Trading
- Trading
- Markets
- Markets
- Platforms
- Platforms
- Platforms
- Platforms
- Education
- Education
- Education
- Education
- Help & support
- Help & support
- About
- Trading
- Trading
- Markets
- Markets
- Platforms
- Platforms
- Platforms
- Platforms
- Education
- Education
- Education
- Education
- Help & support
- Help & support
- About
 News & Analysis
Global Financial Markets: Dispersions and Catalysts
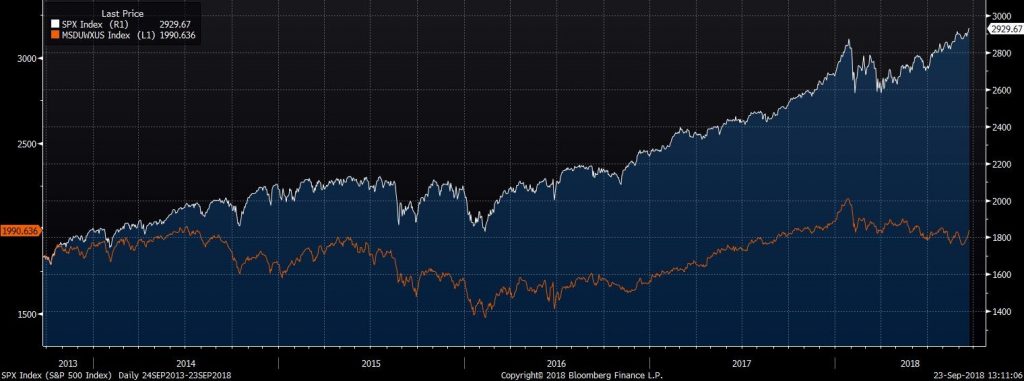
26 September 2018 On GFC’s 10-year anniversary, one cannot help but wonder about the current dispersion in the financial markets. Developed Markets (DM) equities are now divided between US and non-US, with the US outperforming every other major market. S&P is hovering around its all-time highs whereas DM are still well below their 2018 highs.
S&P 500 (White Line) Vs DM (Orange Line)
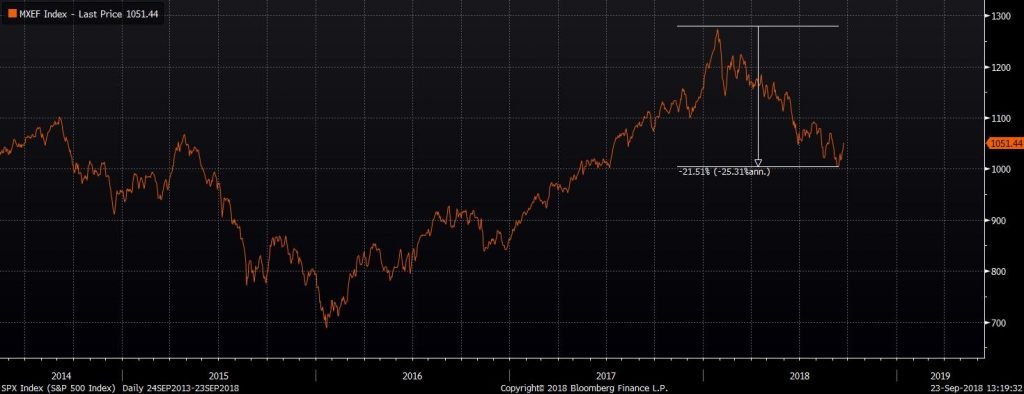
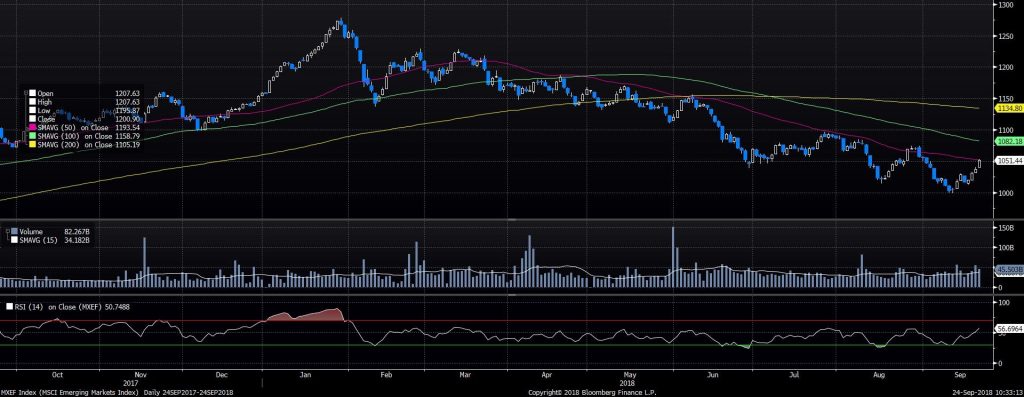
In the Emerging Markets (EM) space, a problem that began with a select few countries managed to end the golden performance of 2016-17, creating an emerging market rout. Based on MSCI EM index, emerging markets were down by almost 21.5% from February highs to the mid-lows in September.
MSCI EM Index
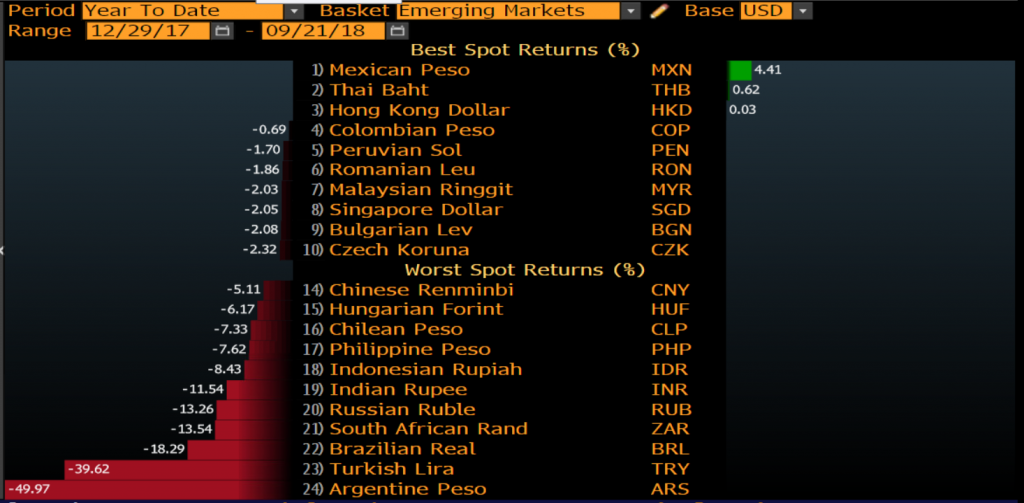
In line with EM equities, the EM currencies have seen some significant moves. Argentine Peso, Turkish Lira and Brazilian Real are all down by 49.97%, 39.62% and 18.29% respectively against the greenback (year-to-date) at the time this report was prepared.
EM Worst Performers
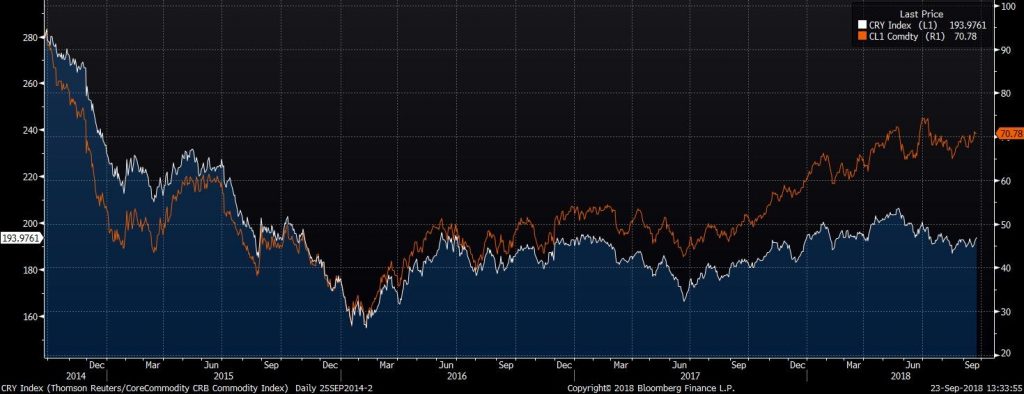
Commodities have been interesting too. Whilst a higher USD pushed commodities down in general, oil has remained relatively strong and is now trading close to a 3-year high.
Thompson Reutters Core Commodity Index (White line) Vs WTI Oil (Orange Line)
Given the above mix, in this article we take a look at the levels and catalysts traders need to watch.
US Equities:
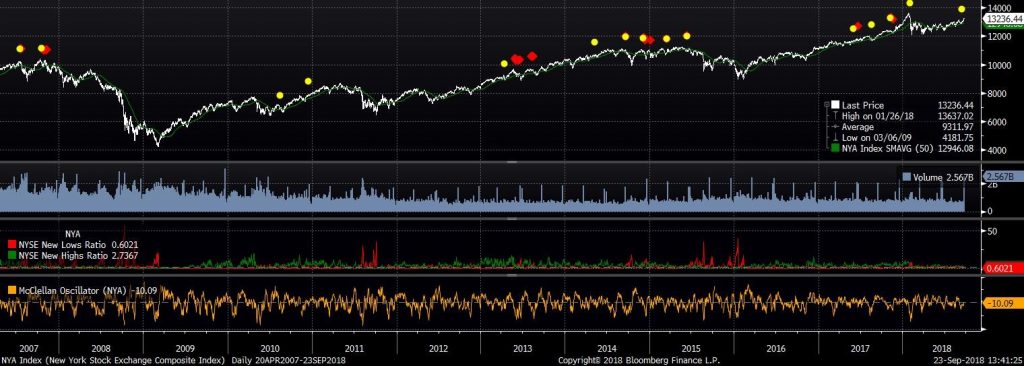
In the past few weeks, prominent market timing indicators called for a correction in the US markets. The first was issued in late August by Tom Demark, whose indicators and analysis are closely watched by the institutional traders, and the second, which was released a couple of weeks ago by Jason Goepfert from Sentiment Trader, in which he drew attention to the emergence of the so-called Hinderberg Omen pattern.
This pattern gauges indecision in the markets and is designed to predict a market correction within 40 days. The yellow dots in the chart below represents the occasions when this indicator has issued warnings.
Hinderberg Omen on NY Composite Index
For S&P to decline, there needs to be a catalyst. In our view, this catalyst will likely have something to do with Trump and his trade tariff war. JP Morgan has recently undertaken an interesting exercise – they used the latest text mining algorithm to scan through 7000 earning transcripts and conference calls. The exercise concluded that companies are now more
worried about the trade war and its impact on their bottom-line rather than that the usual suspects: tax cuts, macro headwinds., etc.
Therefore, we would be closely following the US-China trade war developments now that China has announced an additional set of tariffs on $60b worth of US imports.
For the time being, the trade war doesn’t seem to have had much impact on S&P 500. However, since there is a confluence of technical warnings (both fundamental and technical), we would be looking at the 2860 area in the S&P daily chart (below). Should this level be broken in the next 2-4 weeks, prospects for a correction can increase significantly.
S&P 500
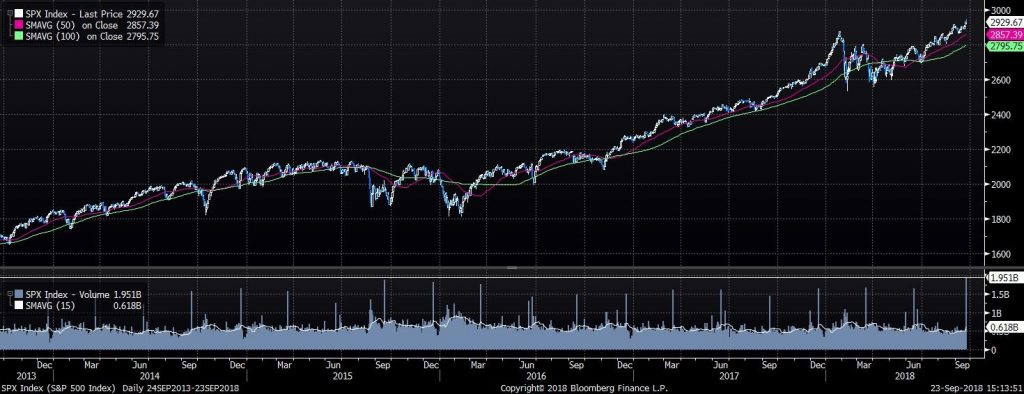
An interesting point in the chart above is the abnormally high volume on last Friday’s close, which happened to be a down day. Volume spikes at the peak of a trend are traditionally signs of inflection points.
Emerging Markets: Still a Concern
Given that EM economies are often interdependent and share the same attributes, analysts did not see the EM developments in isolation and were quick to talk about a contagion risk when Turkey followed Argentina only three months later. Today, a problem that began with a select few countries has turned into an overall EM issue.
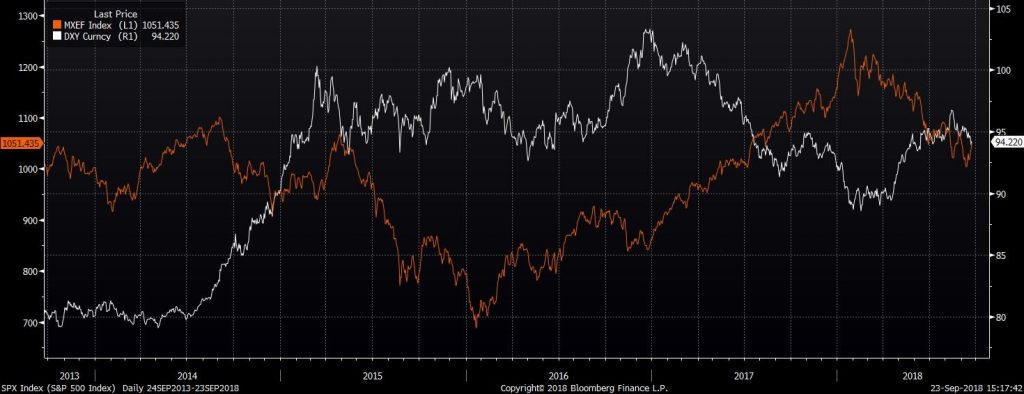
The combination of a higher USD (driven by higher rates in the US) and issues such as the trade war, sanctions and domestic matters in EMs have created a vicious cycle. On one hand, risk-averse investors are selling their emerging market assets due to economic downgrades, slower growth and trade war risks. On the other hand, by repatriating their investments back to the funding currencies (mainly USD), they force emerging market currencies to go lower, which in turn would intrigue more EM assets sales as investors fear their EM asset returns to be diminished by currency depreciation.
Emerging Market Index (Orange Line) Vs US dollar index White Line)
EM Short Term Rebound:
Emerging markets, along with most risk assets, have recovered somewhat over the past couple of weeks. However, we believe this recovery is mainly due to profit taking as opposed to a change of fundamentals. For the trend to reverse, we want to see the EM index to stabilise above 1100.
MSCI EM
Emerging Markets and Risk currencies
The reason FX traders need to be aware of the EM developments is that the EM rout has a direct negative impact on high beta DM currencies such AUD and NZD. This is shown in the chart below, where the orange line is the EM index, the blue line is AUDUSD and the red line is NZDUSD.
Emerging Market index (Orange and AUDUSD (Yellow) and NZDUSD (Blue)
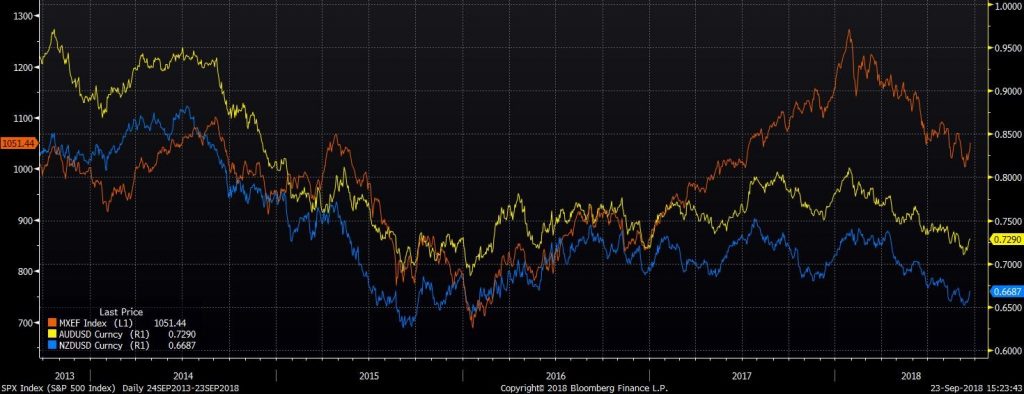
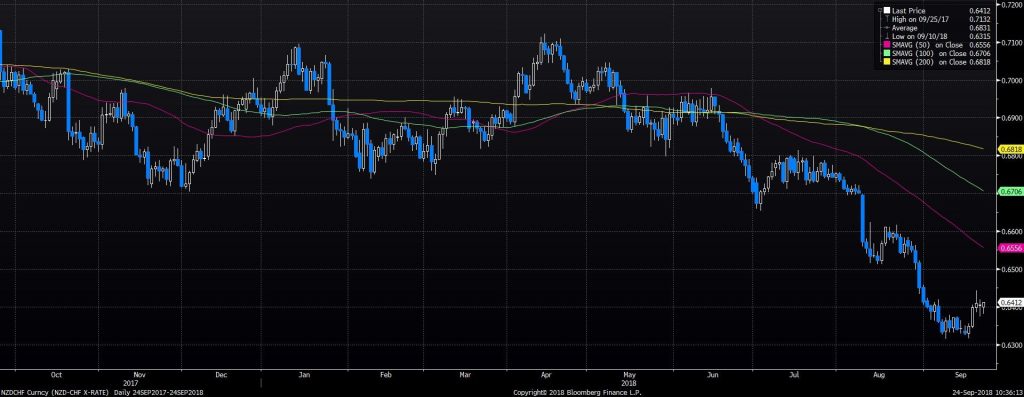
Therefore, as long as the EM rout exists, one should expect further depreciation in the price of AUD and NZD against the USD, and other safe-haven currencies such as JPY and CHF. NZDCHF in particular looks very interesting, with a clear medium-term downward trend.
NZDCHF
Commodities:
While commodities in general will be heavily affected by USD, oil may remain the exception. Many analysts previously believed that cutting Iran out of the production line (as Trump’s deadline is approaching) would only have a minimal impact on the markets – this is because Iran’s relative oil production was deemed to be “just a drop in the ocean”, with Saudi Arabia and other oil-rich countries promising to pick up the shortfall immediately. However, we’ve now seen that these analyst estimations were only good on paper, where what actually is happening is far from theory.
The story went like this: Saudi Arabia announced to the world back in April that they could increase their output to 12.5 million barrels a day to fill in Iran’s gap. The reality is different: Saudi Arabia is presently only producing 10 million barrels a day. To get to the 12.5 million barrels mark, they’ll need to do a lot more drilling, and sooner rather than later. Elsewhere in Russia, production has gone up by 250,000 barrels a day, but this won’t be enough to fill in the 2 million barrels a day gap which would be created when Trump’s sanctions on Iran becomes fully functional.
Production in other OPEC countries hasn’t yet increased much either. Therefore, purely from a basic supply-demand point of view, risks seem to be on the upside rather than the downside.
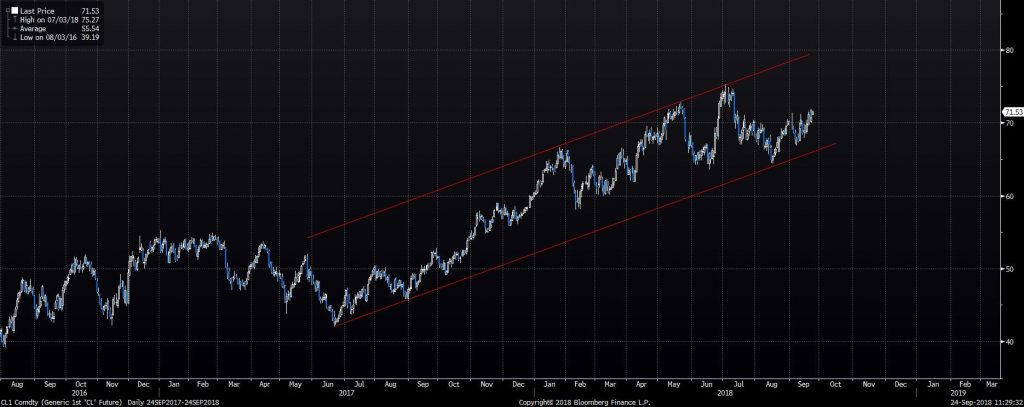
From the technical point of view, oil is now in a strong and healthy bullish channel, which if it remains intact (a likely scenario), an $80 WTI won’t be out of sight.
WTI Crude
The information provided is of general nature only and does not take into account your personal objectives, financial situations or needs. Before acting on any information provided, you should consider whether the information is suitable for you and your personal circumstances and if necessary, seek appropriate professional advice. All opinions, conclusions, forecasts or recommendations are reasonably held at the time of compilation but are subject to change without notice. Past performance is not an indication of future performance. Go Markets Pty Ltd, ABN 85 081 864 039, AFSL 254963 is a CFD issuer, and trading carries significant risks and is not suitable for everyone. You do not own or have any interest in the rights to the underlying assets. You should consider the appropriateness by reviewing our TMD, FSG, PDS and other CFD legal documents to ensure you understand the risks before you invest in CFDs. These documents are available here.
#Forex #ForexAnalysis #ForexBroker #ForexCharts #ForexMarket #ForexNews #ForexSignal #ForexTradingNext Article
FOMC Brief – Sep 2018 Rate Hike
Yesterday, the US Federal Reserve announced the raising of interest rates from to 2.00%~2.25%. Most Fed officials agreed (12 people out of 16) in principle to raise the rate, in line with market expectations, and according to the Dot Plot, the expected interest rate in 2019 & 2020 is 3.2% and 3.6% respectively, which is still...
September 27, 2018Read More >Previous Article
Apple—Can It Survive In Next Decade?
Apple is the first company on this planet to reach a $1 Trillion Market value, each year continuing to release brand new innovative products including...
September 25, 2018Read More >
- Trading
- Trading
- Trading
- Markets
- Markets
- Products overview
- Forex
- Commodities
- Metals
- Indices
- Shares
- Cryptocurrencies
- Treasuries
- Platforms
- Platforms
- Platforms
- Platforms
- Platforms overview
- MetaTrader 4
- MetaTrader 5
- Education
- Education
- Education
- Education
- News & analysis
- Education Hub
- Economic calendar
- Help & support
- Help & support
- About