- Trading
- Trading
- Markets
- Markets
- Platforms
- Platforms
- Platforms
- Platforms
- Education
- Education
- Education
- Education
- Help & support
- Help & support
- About
- Trading
- Trading
- Markets
- Markets
- Platforms
- Platforms
- Platforms
- Platforms
- Education
- Education
- Education
- Education
- Help & support
- Help & support
- About
- There will be a point whereby the market comes to the belief that any such capitulation reflects the potential damage to the economy of any such event (and hence will cease to drop).
- While this is happening, markets look at not only key price levels of previous support and resistance but also perceive important other “landmarks” related to price action. Any breach of these “landmarks” will often have market participants scurrying to find the next one to see if this is also breached.
- At the end of such a market response any “bounce” is often rapid.
- The degree to which price has fallen from recent highs
- What the key moving averages (50 and 200 are often used) are doing both in their relation to price and each other (i.e. whether they have crossed).
- Pull back – up to 10%
- Correction 10-20%
- Bear market – >20%
- Up to the breach of such a key level there may be some caution selling off more than has occurred already (including taking new short positions)
- Once such a breach has occurred, this often precipitates more selling which we saw during Thursday’s US equity market session, taking the price down to the next logical level of potential support.
- Experienced traders always wait for next candle confirmation before even beginning to consider a trend reversal may be taking place.
- The nature of this market move is very headline driven, hence further headlines that indicate that things are changing adversely or otherwise are likely to have a “high risk”, significant short-term impact on sentiment as markets attempt to process new information.
- It is not untypical that at the end of any week where there has been a significant movement, that there is Friday profit taking. After a bullish week this may be traders taking profit in long positions (see gold this week as an example), or, as it could be in this case with Friday’s action, those who are short the equity markets closing down those positions for profit (hence pushing the price higher).
- Having some understanding of what and how market sentiment may help your decision making
- There is no doubt that this is a higher than usual “risk environment”, irrespective of trading direction chosen or what instruments you are trading. Logically therefore, it is worth considering alterations in position sizing or even having a larger than usual amount of your trading capital (as much of the market now does), sitting on the sidelines.
 News & Analysis
Coronavirus equity market action: Too early to call a bottom?
2 March 2020At last week’s Share CFD clinic webinar session on Thursday we discussed the current market response to Coronavirus and key technical levels that could be important.
Clearly market reaction has been significant, market sentiment over the last week has given a clear sentiment message as to the adverse financial implications of Coronavirus.
Of course, this type of reaction to a potential global health epidemic is not unusual – there are many such similar instances and consequent reactions through history of financial markets.
Historically, in terms of how equity markets move may be worth a little more discussion. The following points are worth consideration:
So, what are these “landmarks”?
There appear to be two types that get market attention namely:
With the former, these key levels and subsequent definitions often cited are;
They may be related to indices, sectors and individual stocks.
So, what happened?
If we look at the US500 (CFD associated with the S&P500) on a daily chart as this is what we can access on our MetaTrader platform (see below) there are a few interesting things of note from this week.
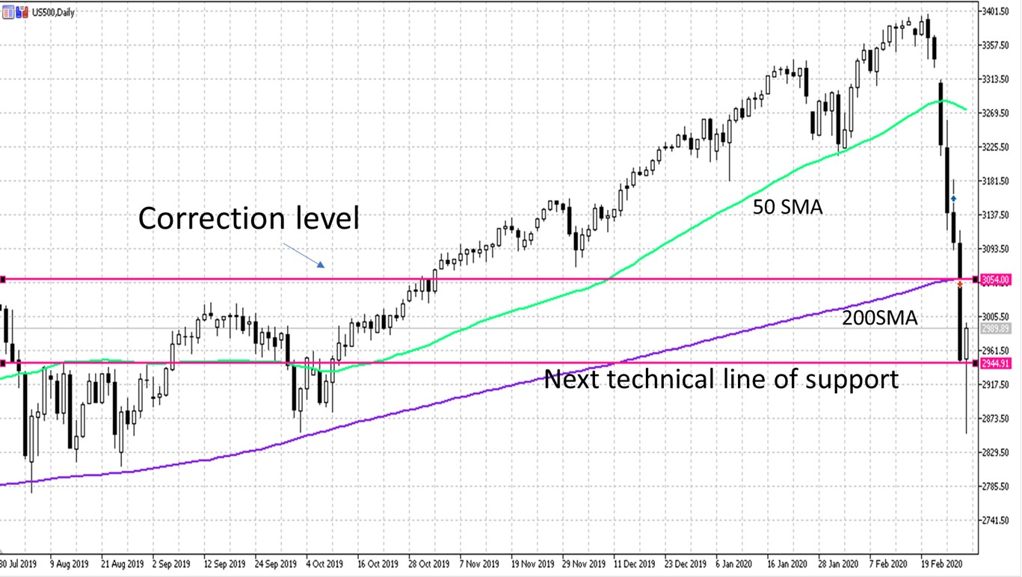
Prior to Thursday session which we discussed at the webinar, the close for the previous day (and subsequent action pre-market) had the price testing both the 10% correction level and the 200 SMA (Simple moving average) at the 3054 level.
As price approaches any such key level, there are two things that are often seen in trader behaviour:
One final point of note. Clearly any index is made up of a ‘basket’ of different stocks from different sectors. In any market downturn or upturn where it has an economic implication, the so called “cyclical” stocks respond more significantly than traditionally defensive stocks. Hence, these sectors e.g. basic material, microchips, consumer discretionary have tended to get hit hardest which may be over 15% down from highs and some even approaching bear market territory.
Does Friday’s action mean that we have seen a bottom?
In another volatile session for equity markets, we saw a low at 10am US EST, and a close near the highs of the session. The candle showed what could be interpreted as a reversal candle with higher close than open and a long wick suggestive of a market rejection of a further move downwards.
Three VITAL points here of note if you are considering whether this may be a ‘bottom’ forming.
Clearly, the market will continue to give us messages but the main ones in terms of your trading (which we hope this article may have helped with) are:
We will be discussing these issues further in this week’s webinar sessions (including tonight’s Inner Circle) which we would be delighted if you could attend, if you are not already part of this weekly education group you can join us at 7.30pm AEDT this evening HERE
Send any comments or questions to [email protected]
Trade safe
Mike Smith
Educator
GO Markets
Disclaimer
The article from GO Markets analysts is based on their independent analysis. Views expressed are of their own and of a ‘general’ nature. Advice (if any) are not based on the reader’s personal objectives, financial situation or needs. Readers should, therefore, consider how appropriate the advice (if any) is to their objectives, financial situation and needs, before acting on the advice.
The information provided is of general nature only and does not take into account your personal objectives, financial situations or needs. Before acting on any information provided, you should consider whether the information is suitable for you and your personal circumstances and if necessary, seek appropriate professional advice. All opinions, conclusions, forecasts or recommendations are reasonably held at the time of compilation but are subject to change without notice. Past performance is not an indication of future performance. Go Markets Pty Ltd, ABN 85 081 864 039, AFSL 254963 is a CFD issuer, and trading carries significant risks and is not suitable for everyone. You do not own or have any interest in the rights to the underlying assets. You should consider the appropriateness by reviewing our TMD, FSG, PDS and other CFD legal documents to ensure you understand the risks before you invest in CFDs. These documents are available here.
#ForexStrategy #ForexTrading #ForexTraining #ForexCourse #ForexEducation #ForexHelp #ForexAnalysis #FXSignal #MetaTrader #MetaTrader4 #MetaTrader5Next Article
Mind the gap! Strategies to managing ‘gapping’ risk with Shares and Share CFDs
Obviously, one of the major differences between trading shares or share market derivatives (e.g. Share CFDs and Options) compared to other instruments such as Forex and Index or Commodity CFDs, is the daily set market hours and the risk of potentially significant differences in price between the close of one trading session and the openin...
March 10, 2020Read More >Previous Article
Inner Circle Video: “Why is my trading system not working?”
Please find below the recording of the video from this weeks exciting Inner Circle session “Why is my trading system not working?": Five key areas t...
February 20, 2020Read More >
- Trading
- Trading
- Trading
- Markets
- Markets
- Products overview
- Forex
- Commodities
- Metals
- Indices
- Shares
- Cryptocurrencies
- Treasuries
- Platforms
- Platforms
- Platforms
- Platforms
- Platforms overview
- MetaTrader 4
- MetaTrader 5
- Education
- Education
- Education
- Education
- News & analysis
- Education Hub
- Economic calendar
- Help & support
- Help & support
- About