- Trading
- Trading
- Markets
- Markets
- Platforms
- Platforms
- Platforms
- Platforms
- Education
- Education
- Education
- Education
- Help & support
- Help & support
- About
- Trading
- Trading
- Markets
- Markets
- Platforms
- Platforms
- Platforms
- Platforms
- Education
- Education
- Education
- Education
- Help & support
- Help & support
- About
 News & Analysis
Point & Figure Analysis – A Japanese Cliffhanger
24 February 2016Annihilation of the Yen
It was the year 2013. Some interesting events took place that caused some reverberations in global markets. The once one booming city of Detroit (known for its car manufacturing) filed for bankruptcy and the US government shutdown for almost two weeks. But the most significant story was the fall of the Japanese currency against all its major counterparts.
A dangerous climb
In 2013 the value of the Yen fell 21% against the US dollar, making it the most sizeable yearly gain against the Asian currency since 1979. Whenever a currency pair rises or falls this quickly, traders have a tendency to become complacent and think it will continue regardless.
If we’re looking for an analogy, we can view the rise of the US dollar and other currencies to lofty heights against the Yen as something similar to an inexperienced or over-zealous climber attempting to reach the top, but failing to plan for future events and construct a safe passage back down.
Resurrection of the Yen
Despite the Japanese government’s best efforts – adopting negative interest rates and championing an aggressive stance to help weaken their currency – the Yen has gained both in strength and popularity in 2016. And this is creating some significant moves in the FX world.
Before we discuss the technical side of the charts, it is worth noting that all the Japanese pairs mentioned are currently following a bearish resistance line (BR) or downtrend according to the latest point and figure analysis.
Finding 300+ pip moves
In the previous newsletter introducing point and figure, we discussed why this method is an excellent tool for locating key areas of support and resistance.
The recurring Yen pattern we’ve identified here was discovered using point and figure. It suggests some long-term moves that could be over 300+ pips in total.
The freefall pattern
The pattern itself if is quite simple. It appears as if the sharpest JPY declines of 2013 are now becoming the largest JPY rallies of 2016.
Consider the climbing analogy, the latest price swings and resulting patterns are the climbing equivalent of forgetting to place anchors in the cliff face in preparation for the abseil back down.
When we study the charts, there are simply no immediate signs of support or footholds that the pairs can target leaving them vulnerable to a potential freefall. As the same pattern is discussed over multiple pairs, we can analyse this into three sections:
» Completed
» In-progress
» Emerging.Completed Pattern – CADJPY
Click to enlarge
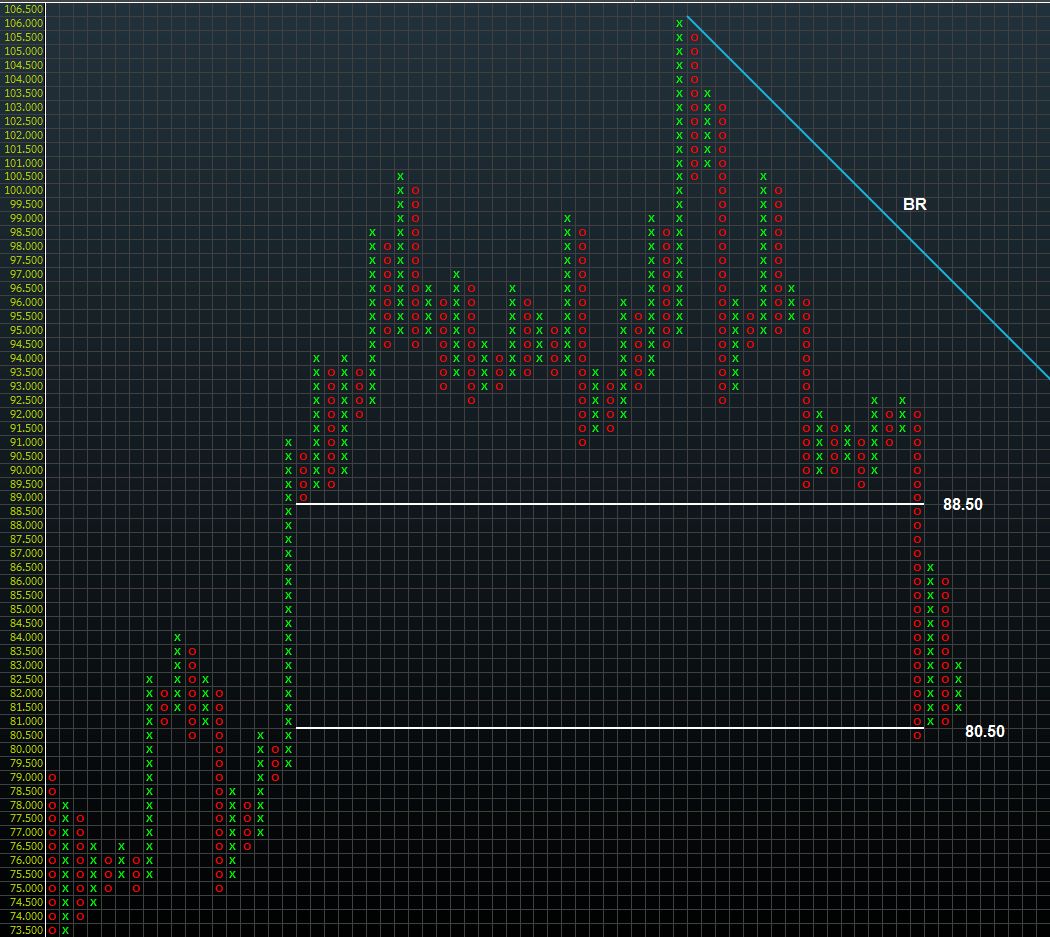
In a previous CADJPY article, we discussed the importance of the triple bottom located at the 90.00 level and the distinct lack of support below. This is the first example of the pattern of what might happen to some of these JPY pairs once key support levels are breached.
No doubt the pressure of global oil prices on the Canadian dollar helped accelerate this move.
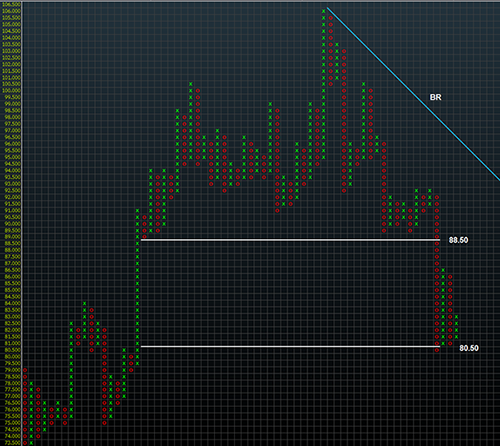
As we can see from the chart above, the CADJPY fell to our longer-term target of 80.50 before finding adequate support. The pattern almost resembles a window where price drops significantly to the previous level of demand.
This pair may be consolidating now, especially looking at the most recent price action. While the key level of 80.50 may continue to act as a strong support, resistance to the upside appears to be located at 84.00 and 86.50.
In-progress pattern – USDJPY, GBPJPY
USDJPY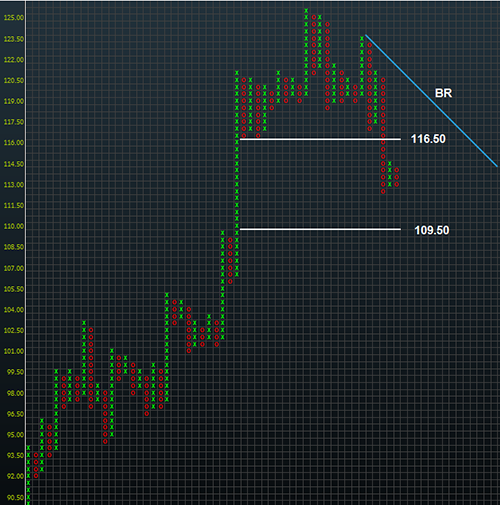
Click to enlarge
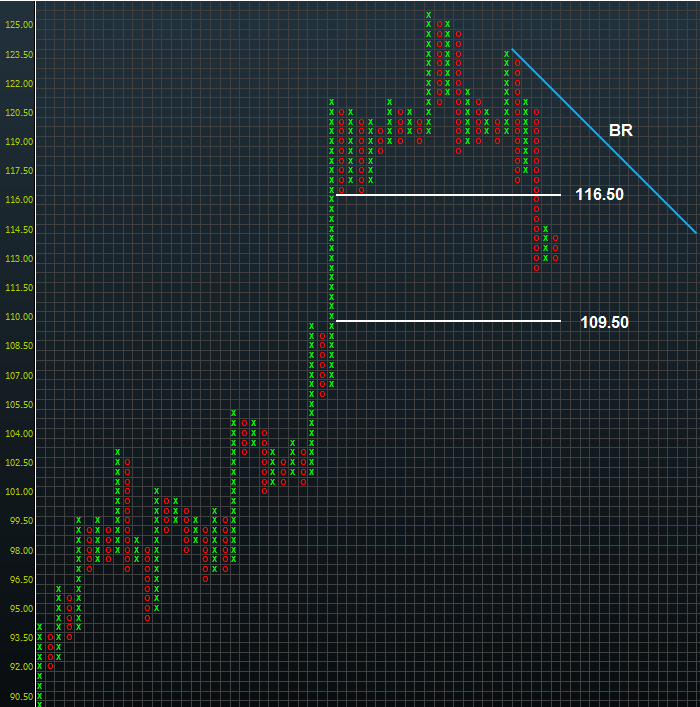
We also discussed the latest USDJPY move in a recent article and currently we have a longer-term target price of 109.50. Clearly the break of the spread triple bottom at 116.50 was when this pattern activated and the price dropped from 116.50 down to 112.50 creating a 400 pip move.
The pair has since recovered but the main point to take note of is the recent change from an uptrend following a bullish support line (BS) to a downtrend following a bearish resistance line (BR).
The level of 114.50 has established as short-term resistance and above here 116.50 may attempt to cap any bullish plays.
GBPJPY
Click to enlarge
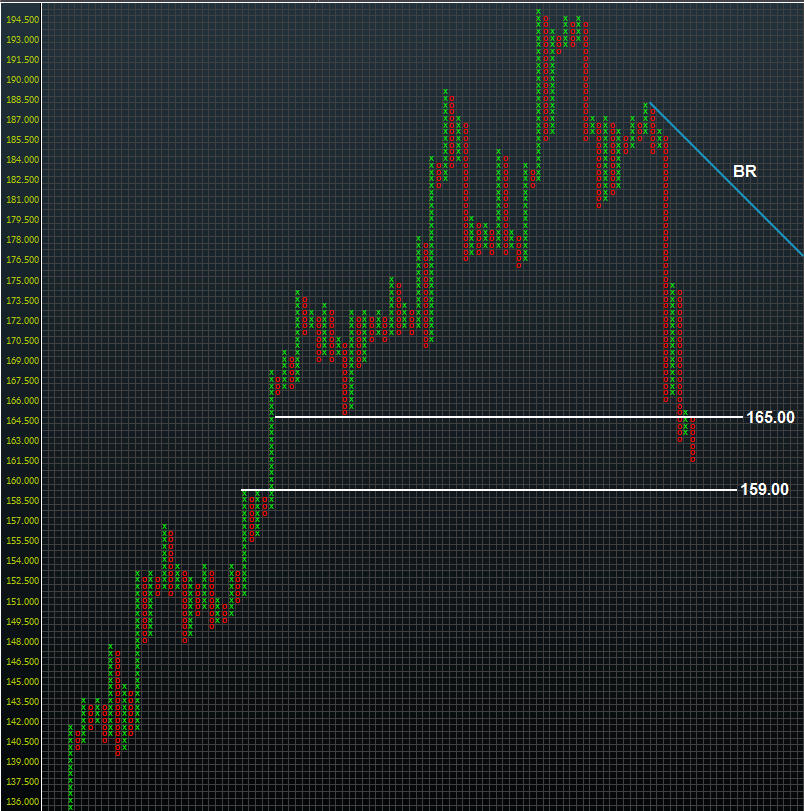
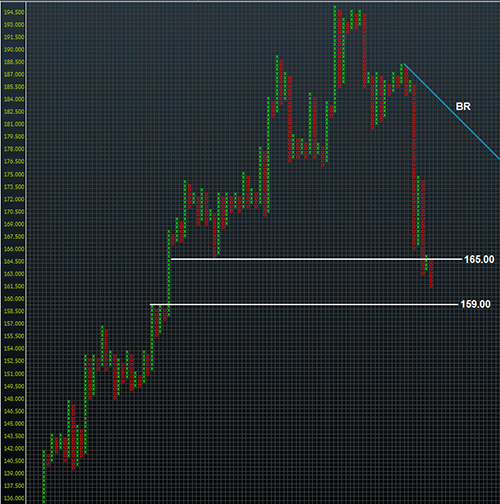
Similar to the USDJPY pair, we can see the pattern is in progress here with a downside target of 159.00 where a previous triple top is found. The trigger point for this move was when the price broke through the spread double bottom at 165.00.
Certainly one of the weakest currencies at the time of writing, the Pound has been one of the worst affected by the sudden surge in strength of the Yen. With the looming threat of a ‘Brexit’ (Britain exiting the Euro zone) towards the end of June this year, things may end up going from bad to worse for the GBPJPY pair.
Emerging pattern– EURJPY, NZDJPY, AUDJPY
EURJPY
Click to enlarge
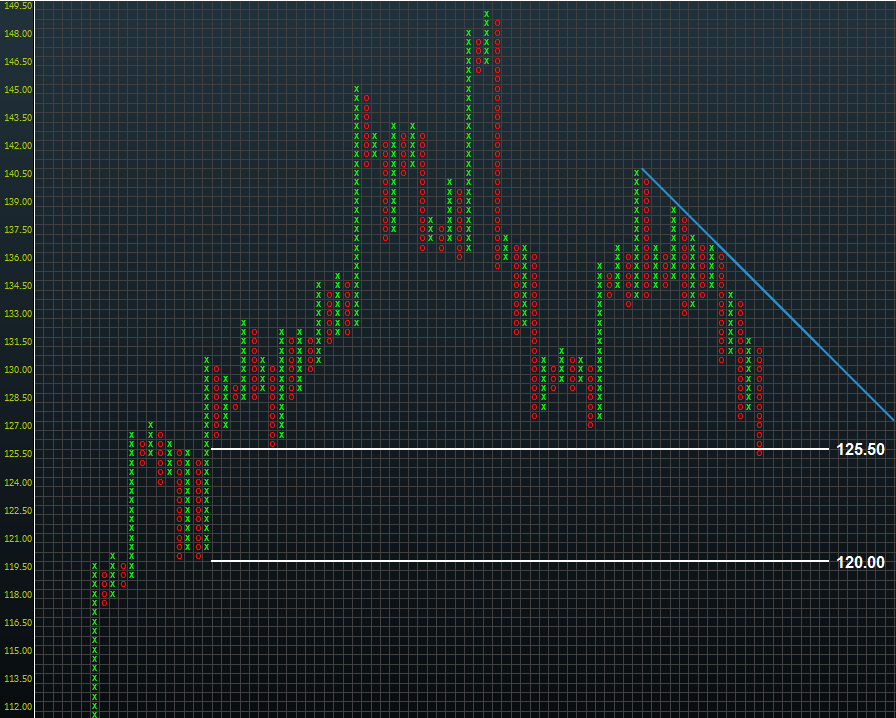
The last group, which we believe has the potential to move in similar fashion to the completed CADJPY pair, is sitting around key support levels which are beginning to look slightly exposed to the downside.
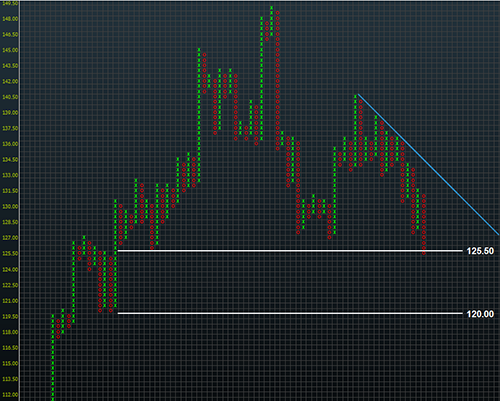
The EURJPY has recently produced a sell signal after breaching the 125.50 level. If we look at the chart, there appears to be a glimmer of support around 124.00, but a longer-term target of 120.00 would be the more obvious choice.
The pair has had a rocky road on the way down so far perhaps this would be one of the most stable shifts down if the pattern continued.
NZDJPY
Click to enlarge
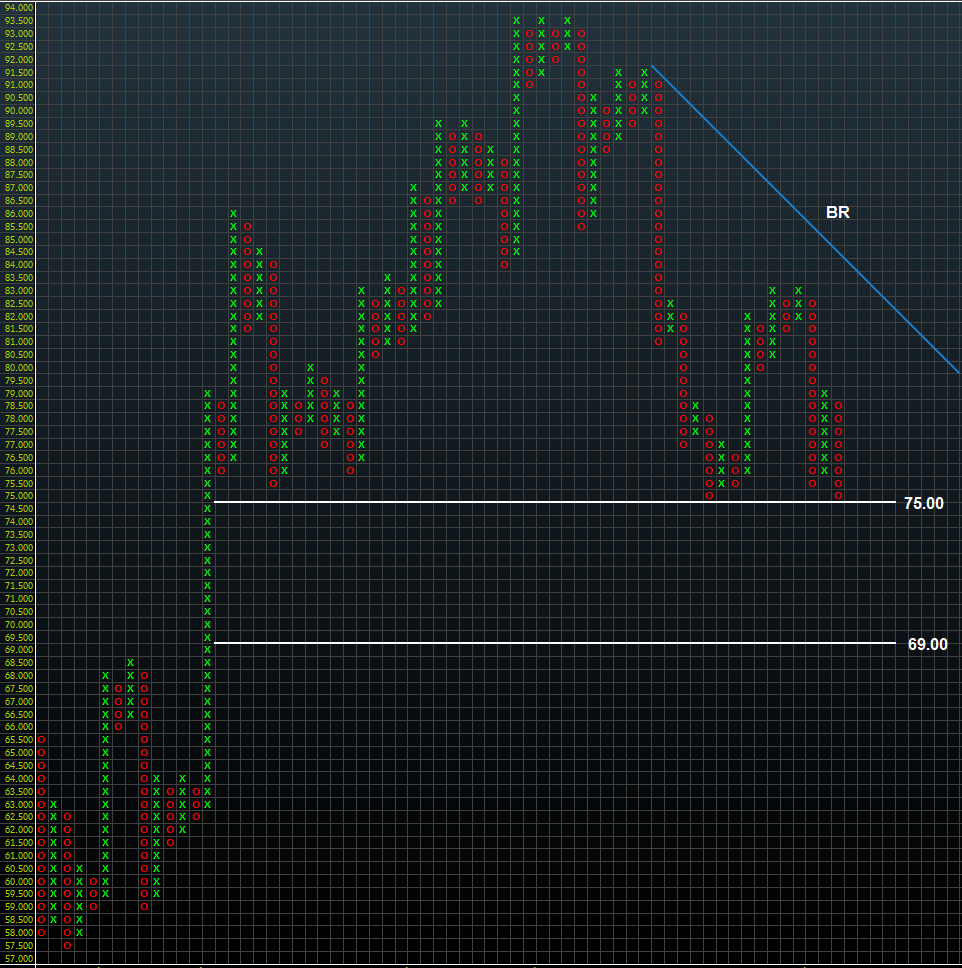
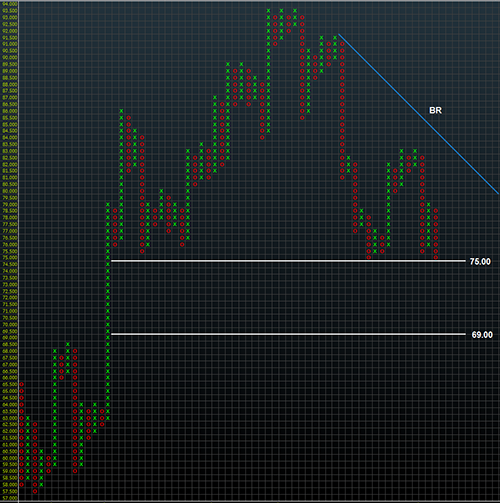
The potential NZDJPY setup looks to be one of the cleanest examples of this freefall window pattern. During the past couple of weeks, price action has danced around the key support level 75.00 which is also a spread double bottom.
If this area fails to hold, the next longer-term support and initial target would be 69.00 at this stage.
AUDJPY
Click to enlarge
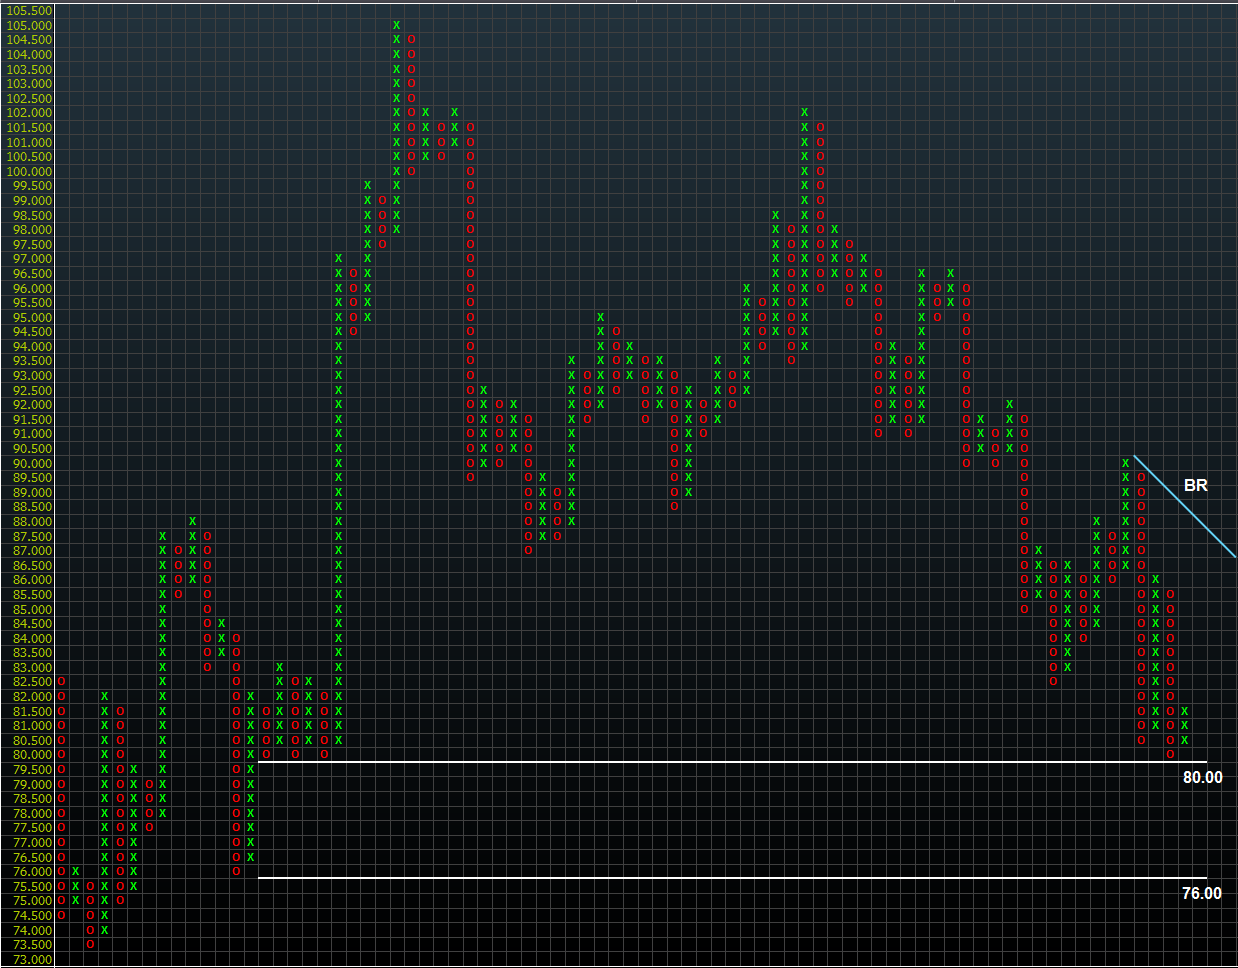
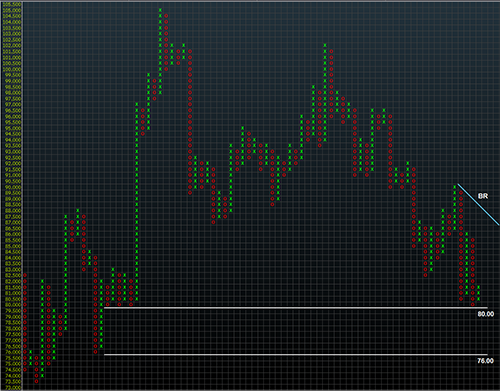
Although closely related to the NZDJPY pair, the Australian counterpart AUDJPY doesn’t seem to belong to this group. Of course, the potential is still clearly visible on the chart between the levels of 80.00 and 75.00, but the Australian dollar may be more resilient based on recent events and previous price action.
In summary, the pattern itself is not unique. If you follow point and figure, you will notice similar setups on various trading products from time to time. What makes it interesting is that it appears to be happening on nearly all the Yen pairs simultaneously.
The completed pattern on the CADJPY went directly to the nearest support which was almost a thousand pips away. But do not be fooled by the process.
Remember these are generally long-term set-ups and without any obvious signs of support, the market may gravitate towards round numbers with psychological importance or become less reliable in general.
There is also an alternate scenario whereby the Yen finds a bottom at current market levels and some of these key areas of support hold, perhaps providing a springboard for price action in the coming months. This also could present an opportunity to find some reasonable risk/reward trades.
If you would like to keep up-to-date follow on Twitter or through the GO Markets technical analysis section.
The opinions and information conveyed in the GO Markets newsletter are the views of the author and are not designed to constitute advice. Trading Forex and CFD’s is high risk.

Adam Taylor | Senior Analyst Adam Taylor joined the GO Markets’ team in early 2013 and has gone on to become a valued analyst on our Research and Trading team.
Adam’s key strength lies in his technical analysis skills, perhaps honed over his time as a Champion Chess player for his native Scotland. While Adam’s primary role is concentrated towards risk management for GO Markets, he’s a regular contributor to our News and Analysis team, using the highly regarded but rarely used, point and figure method.
The information provided is of general nature only and does not take into account your personal objectives, financial situations or needs. Before acting on any information provided, you should consider whether the information is suitable for you and your personal circumstances and if necessary, seek appropriate professional advice. All opinions, conclusions, forecasts or recommendations are reasonably held at the time of compilation but are subject to change without notice. Past performance is not an indication of future performance. Go Markets Pty Ltd, ABN 85 081 864 039, AFSL 254963 is a CFD issuer, and trading carries significant risks and is not suitable for everyone. You do not own or have any interest in the rights to the underlying assets. You should consider the appropriateness by reviewing our TMD, FSG, PDS and other CFD legal documents to ensure you understand the risks before you invest in CFDs. These documents are available here.
#Forex #ForexAnalysis #ForexBroker #ForexCharts #ForexMarket #ForexNews #ForexSignal #ForexTradingNext Article
Bank of Japan opts for negative interest rate, but Yen soars
This is only Part 1 of a 3-part series containing a full 21 page analysis, highlighting the global opportunities as a result of the introduction of negative interest rates in Japan. Click here to access the full analysis. ...
February 24, 2016Read More >Previous Article
Be prepared and trade smart with the MT4 Genesis Session Map
Forex is one of the heaviest news driven markets in the world. Major news announcements play such a critical role to the intraday volatility, which in...
February 24, 2016Read More >
- Trading
- Trading
- Trading
- Markets
- Markets
- Products overview
- Forex
- Commodities
- Metals
- Indices
- Shares
- Cryptocurrencies
- Treasuries
- Platforms
- Platforms
- Platforms
- Platforms
- Platforms overview
- MetaTrader 4
- MetaTrader 5
- Education
- Education
- Education
- Education
- News & analysis
- Education Hub
- Economic calendar
- Help & support
- Help & support
- About