- Trading
- Trading
- Markets
- Markets
- Platforms
- Platforms
- Platforms
- Platforms
- Education
- Education
- Education
- Education
- Help & support
- Help & support
- About
- Trading
- Trading
- Markets
- Markets
- Platforms
- Platforms
- Platforms
- Platforms
- Education
- Education
- Education
- Education
- Help & support
- Help & support
- About
 News & Analysis
US Indices at Record Highs
3 August 2017US Indices at Record Highs
US Indices have hit record highs in 2017 and are continuing to rally since the Trump presidency began back in January. The recent rally in the US Indices is mainly due to big number of companies reporting stronger performance results than the experts were predicting and a weaker dollar. Now let’s look at how the main US Indices have been performing in 2017.
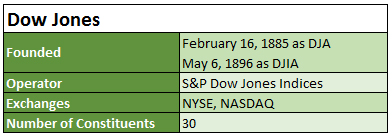
Dow Jones Industrial Average
About the Dow
The Dow Jones Industrial Average (The Dow, WS30 on the Go Markets MetaTrader FX trading platform) is a price weighted measure of 30 US blue chip companies. This Index covers all industries apart from utilities and transportation.
Source: http://us.spindices.com The Dow in 2017
On 25th January 2017, Dow Jones reached the landmark 20,000 barrier for the first time ever as Trumps pro-growth policies boosted the financial markets. It took under a month for the Index to close at 20,500-mark for the first time ever. Then on 1st March, the Dow reached the 21,000-mark for the first time and the rally continued.
Just over 5 months later, on 2nd August, the Dow reached the 22,000-mark for the first time ever after Apple posted quarterly results that beat the expectations.WS30
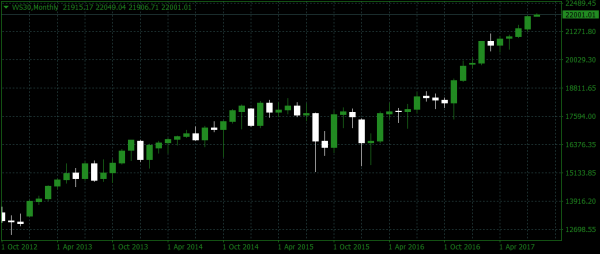
Source: Go Markets MT4 S&P 500
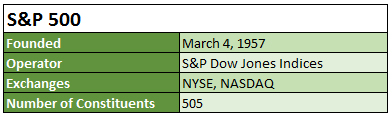
About S&P 500
The Standard & Poor’s 500 (S&P 500, US500 on the Go Markets MetaTrader 4 platform) is an American stock market index, generally viewed as the best single gauge of large-cap US equities. There is over $7.8 trillion USD benchmarked to the index, with index assets comprising around $2.2 trillion USD of this total. The Index includes 500 top companies and captures approximately 80% coverage of the available market capitalization.
Source: http://us.spindices.com 
Source: http://us.spindices.com 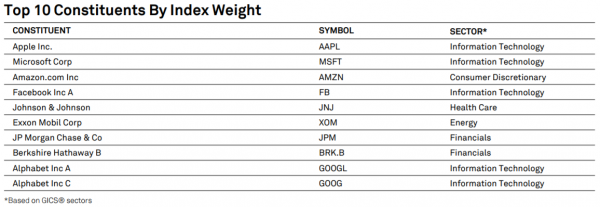
Source: http://us.spindices.com S&P 500 in 2017
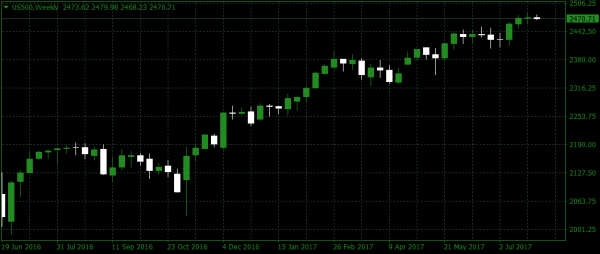
The Index first reached the 2,300-mark on 26th January before falling below the level at closing. It took two weeks before the S&P 500 finally closed above 2,300. The S&P first crossed 2,400 on 1st March before again falling below that level at closing. The Index finally closed at above 2,400 on 15th May.
As you can see in the chart below, the S&P 500 has been climbing consistently in 2017 and the Index broke the 2,450-mark on 19th June and it is predicted that it will reach new highs by the end of the year.US500
Source: Go Markets MT4 By: Klavs Valters
GO MarketsThe information provided is of general nature only and does not take into account your personal objectives, financial situations or needs. Before acting on any information provided, you should consider whether the information is suitable for you and your personal circumstances and if necessary, seek appropriate professional advice. All opinions, conclusions, forecasts or recommendations are reasonably held at the time of compilation but are subject to change without notice. Past performance is not an indication of future performance. Go Markets Pty Ltd, ABN 85 081 864 039, AFSL 254963 is a CFD issuer, and trading carries significant risks and is not suitable for everyone. You do not own or have any interest in the rights to the underlying assets. You should consider the appropriateness by reviewing our TMD, FSG, PDS and other CFD legal documents to ensure you understand the risks before you invest in CFDs. These documents are available here.
#Indice #Indices #IndicesTrading #IndexTrading #Shares #Stockmarket #StocksNext Article
South Africa Jacob Zuma Update
South Africa Update 8th August 2017, the day president of South Africa, Jacob Zuma survived a no-confidence vote in parliament, which made sure that he will maintain power of one of the biggest economies in the African continent. It is worth noting that it was the eighth vote of no-confidence that Zuma has survived since being in charge. About Jac...
August 10, 2017Read More >Previous Article
The Bank of England Rate Decision
The Bank of England on the 3rd August, will announce whether they will increase, decrease or maintain the key interest for the United Kingdom. In thi...
July 28, 2017Read More >
- Trading
- Trading
- Trading
- Markets
- Markets
- Products overview
- Forex
- Commodities
- Metals
- Indices
- Shares
- Cryptocurrencies
- Treasuries
- Platforms
- Platforms
- Platforms
- Platforms
- Platforms overview
- MetaTrader 4
- MetaTrader 5
- Education
- Education
- Education
- Education
- News & analysis
- Education Hub
- Economic calendar
- Help & support
- Help & support
- About