- Trading
- Trading
- Markets
- Markets
- Platforms
- Platforms
- Platforms
- Platforms
- Education
- Education
- Education
- Education
- Help & support
- Help & support
- About
- Trading
- Trading
- Markets
- Markets
- Platforms
- Platforms
- Platforms
- Platforms
- Education
- Education
- Education
- Education
- Help & support
- Help & support
- About
 News & Analysis
Forex 10 Year Challenge
4 February 2019
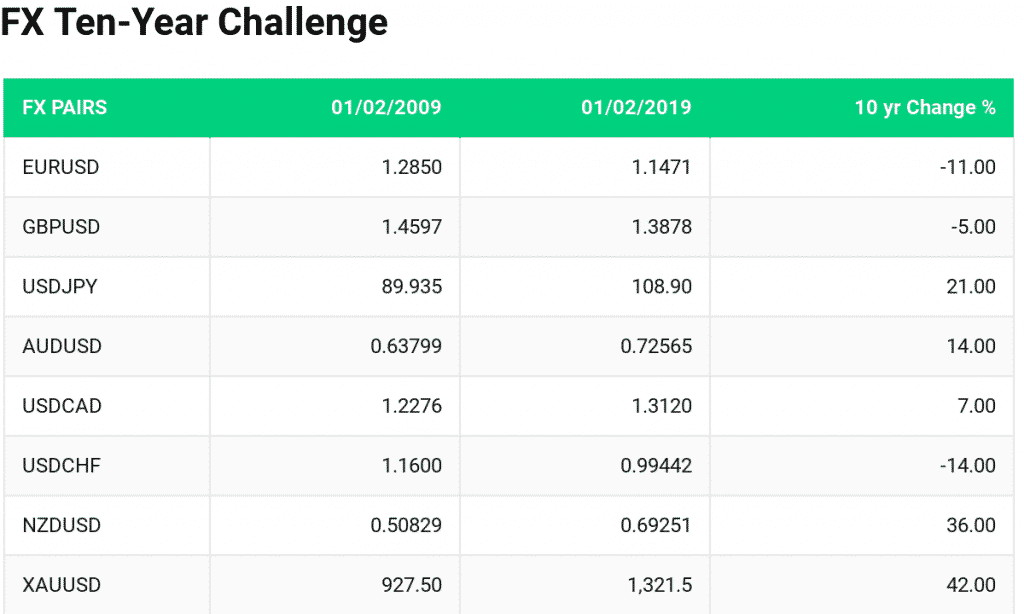
To begin the week, I thought we’d do something a little bit different. We have taken the current ten-year challenge sweeping social media and tried to apply it to a brief technical analysis summary of the major FX pairs. Where were they trading in early 2009? And where are they now?
Judging by the list below, it would seem gold wins the gold medal regarding overall performance. The following summaries will delve further into each trading pair.
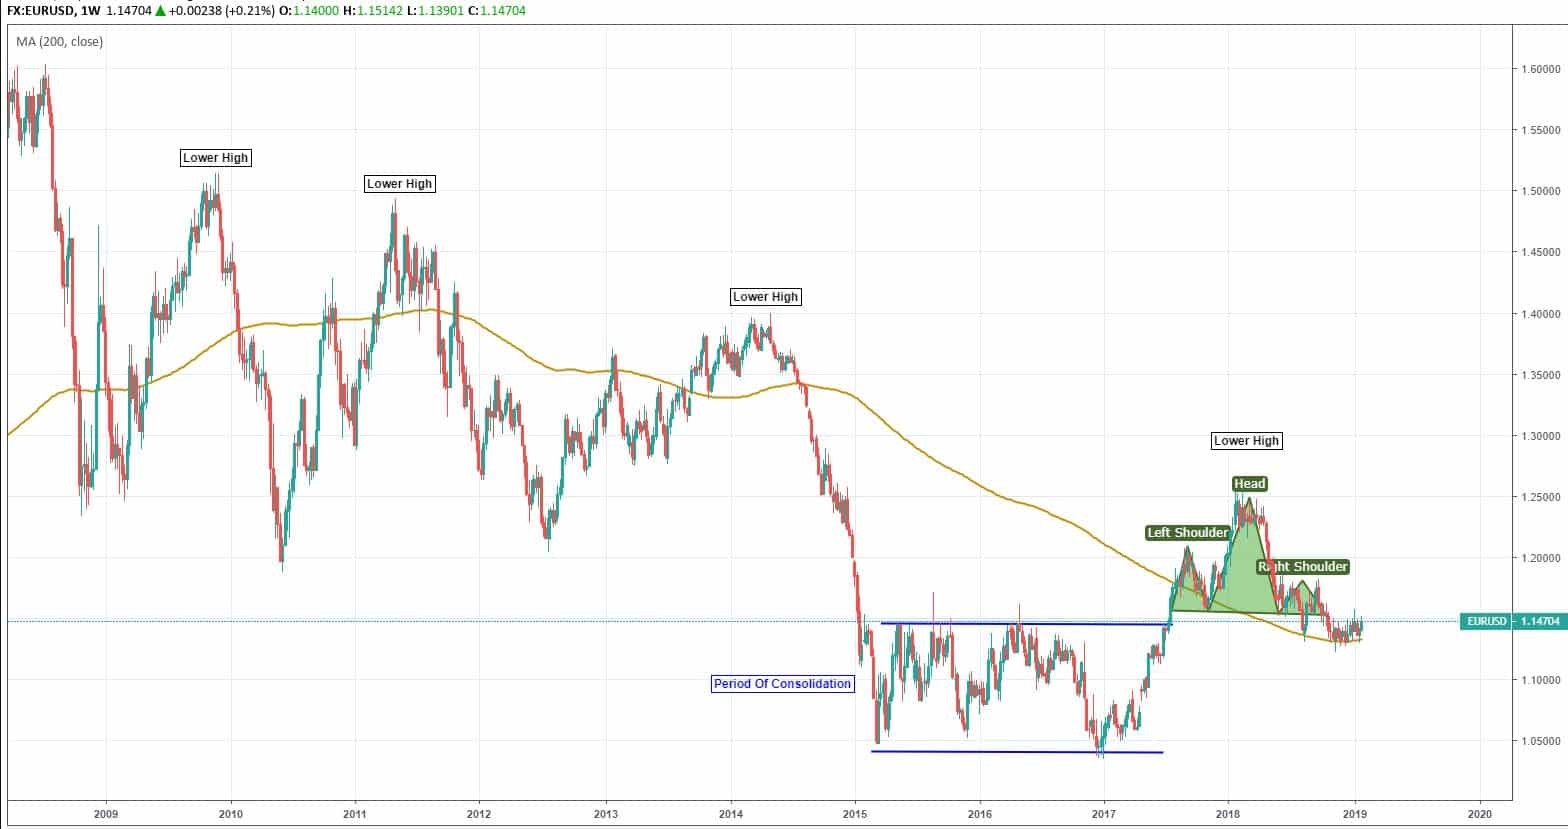
EURUSD
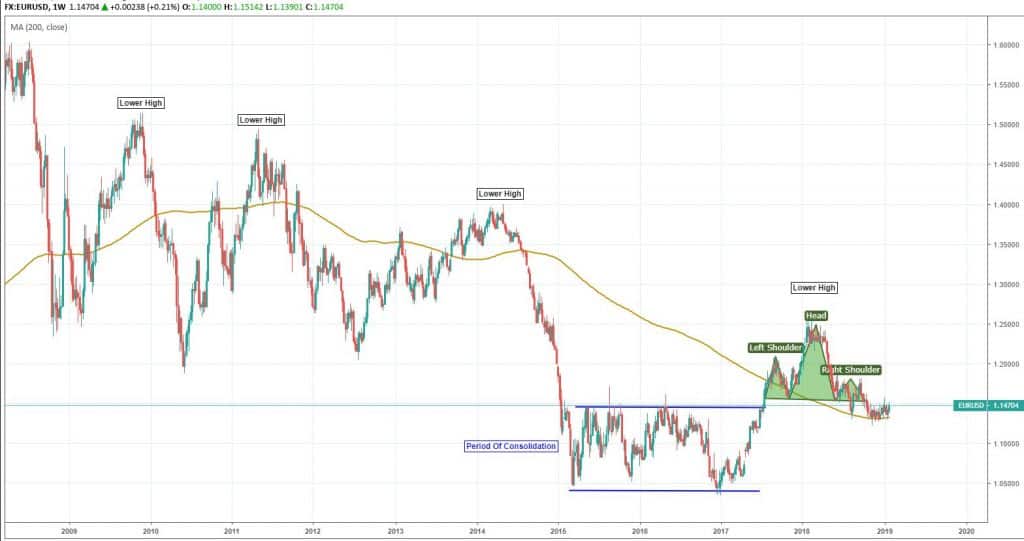
Even though current price action is trading just above the 200 MA suggesting the longer-term trend is bullish, the price action since 2009 provides more significant evidence of a strong downtrend in place, most notably the lower highs witnessed in 2009, 2011, 2014 and last year respectively. Following the rather dull consolidative period between 2015 to 2017, the Euro-Dollar pair has shown a new lease of life and has found the 1.25 level to play a significant role once again. At current levels though, the danger here is that we could slip back into the familiar rangebound territory if the supportive structure seen at 1.14 fails to contain sellers going forward. The highlighted head and shoulders pattern might be a precursor to a EURUSD reversal back towards the 1.05 lows.
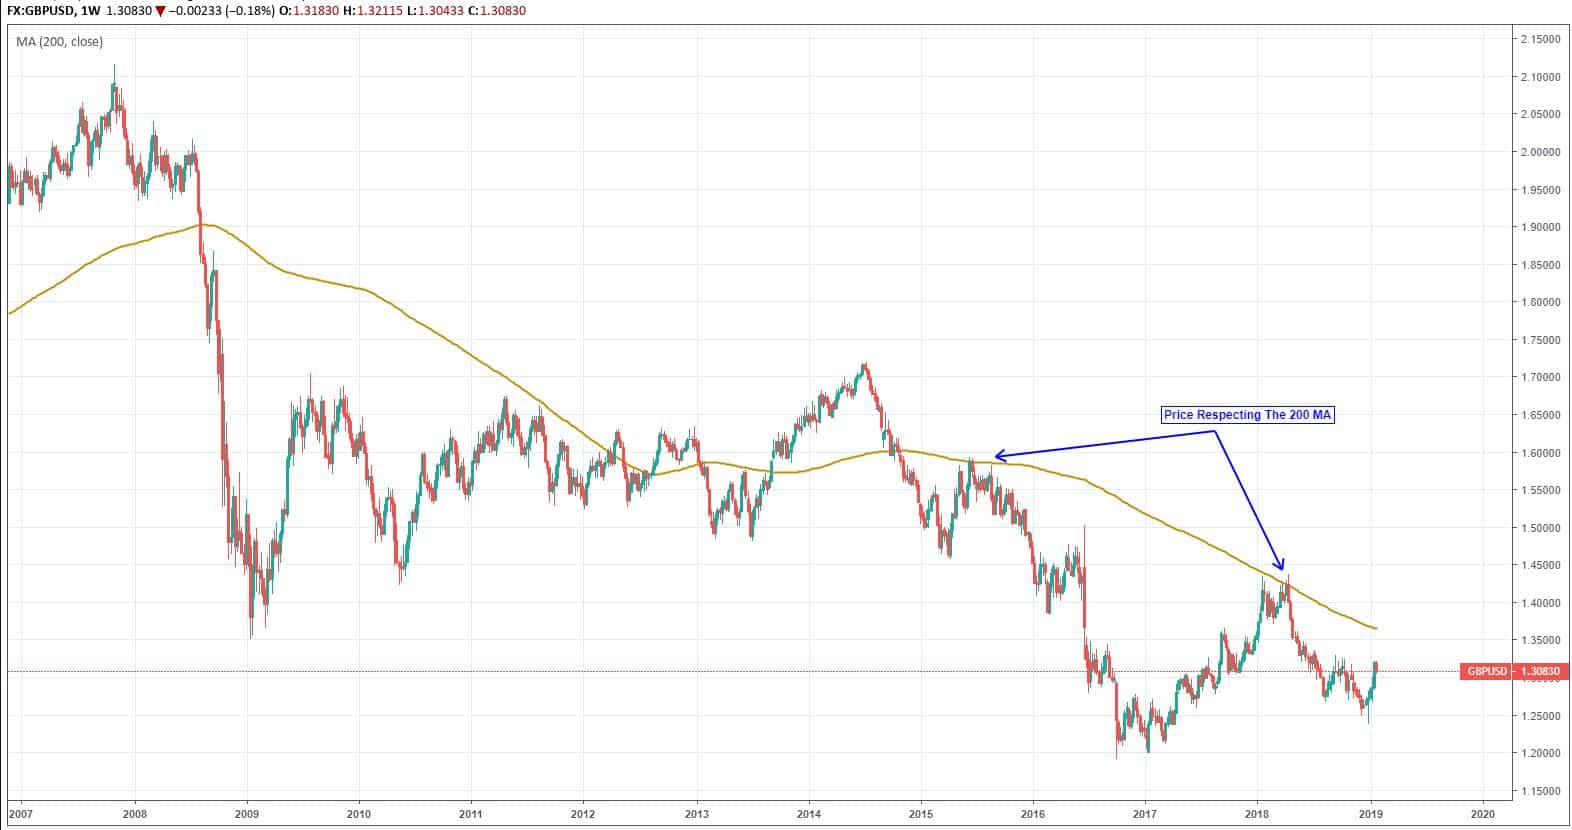
GBPUSD

Surprisingly, only a 5% difference in value since this time ten years ago. We see mostly rangebound moves since 2009, with the Brexit catalyst in 2016 providing fuel for an extended step down in price. The recovery from 2017 to the beginning of 2018 may give a clue to future movements within the pair. Notice how the price has respected the 200 MA in recent years, it would appear the region of 1.35 could be a potential barrier if tested, resulting in a continuation of the longer-term downtrend. In this scenario, the previous 1.20 support is a target worth considering.
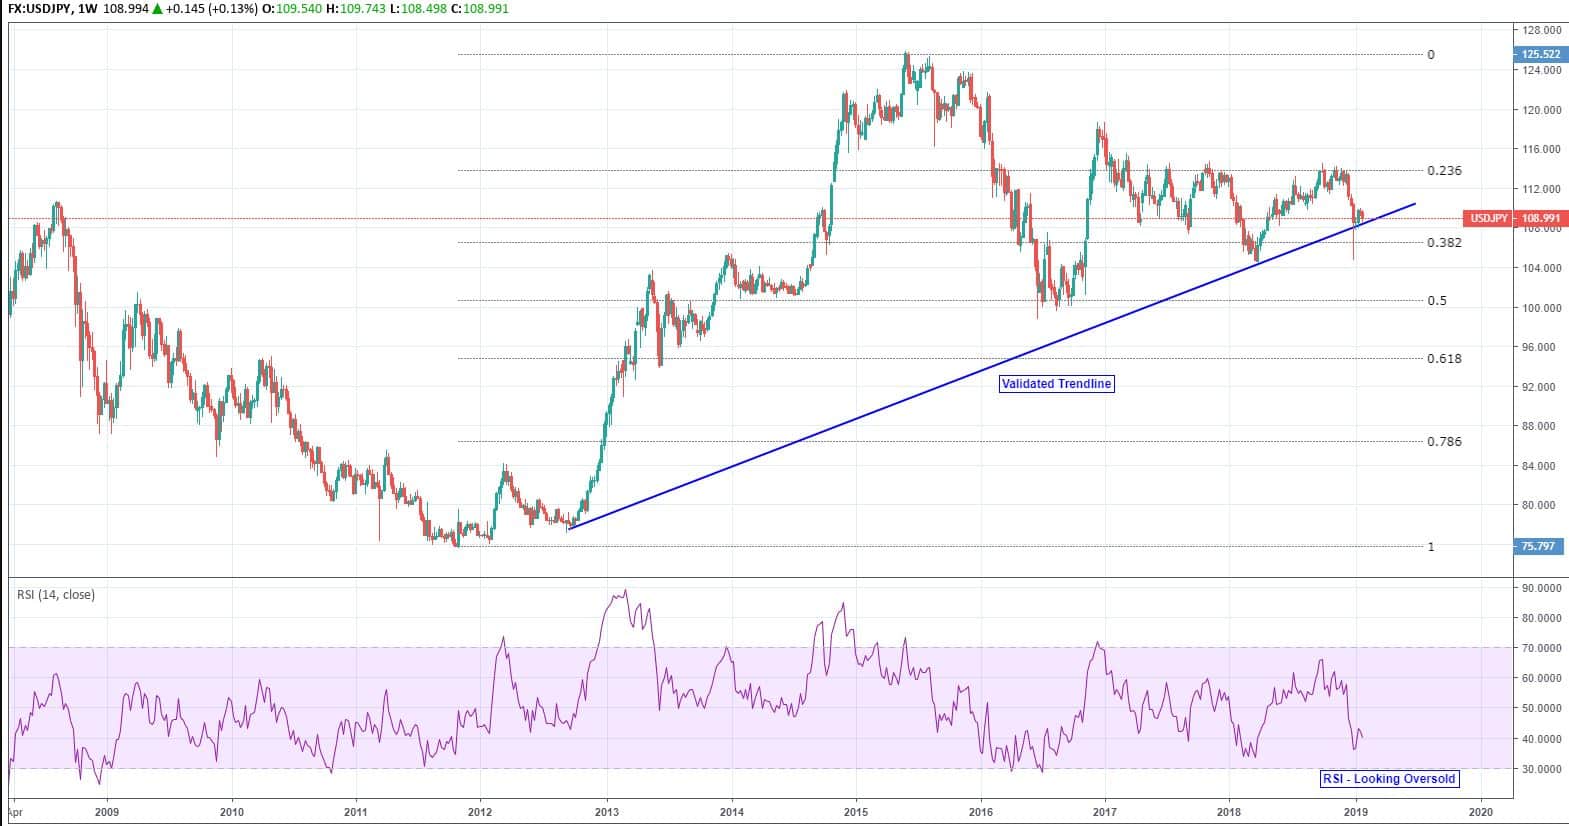
USDJPY
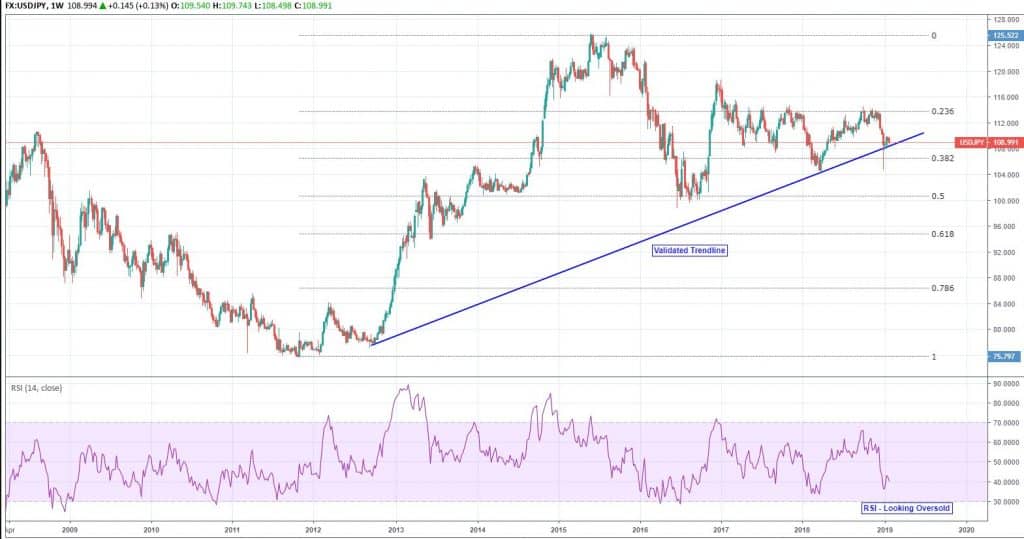
In 2009 the Dollar-Yen pairing appeared somewhat heavy towards the downside. However, we’ve seen a steady recovery since the 2012 lows, and a validated bullish trendline is currently in play. In December last year, price attempted a sharp move down to 104 levels but was quickly rejected, resulting in further Dollar strength. Key areas to note are the Fibonacci retracements of the 2015 high including the 50% level which has provided strong support around 100.00 and the 23.6% retracement at 113.80 which continues to act as tough resistance. Perhaps we’ll see another rally north to re-test 113.80 longer-term, especially when RSI (Relative Strength Index) levels are looking oversold.
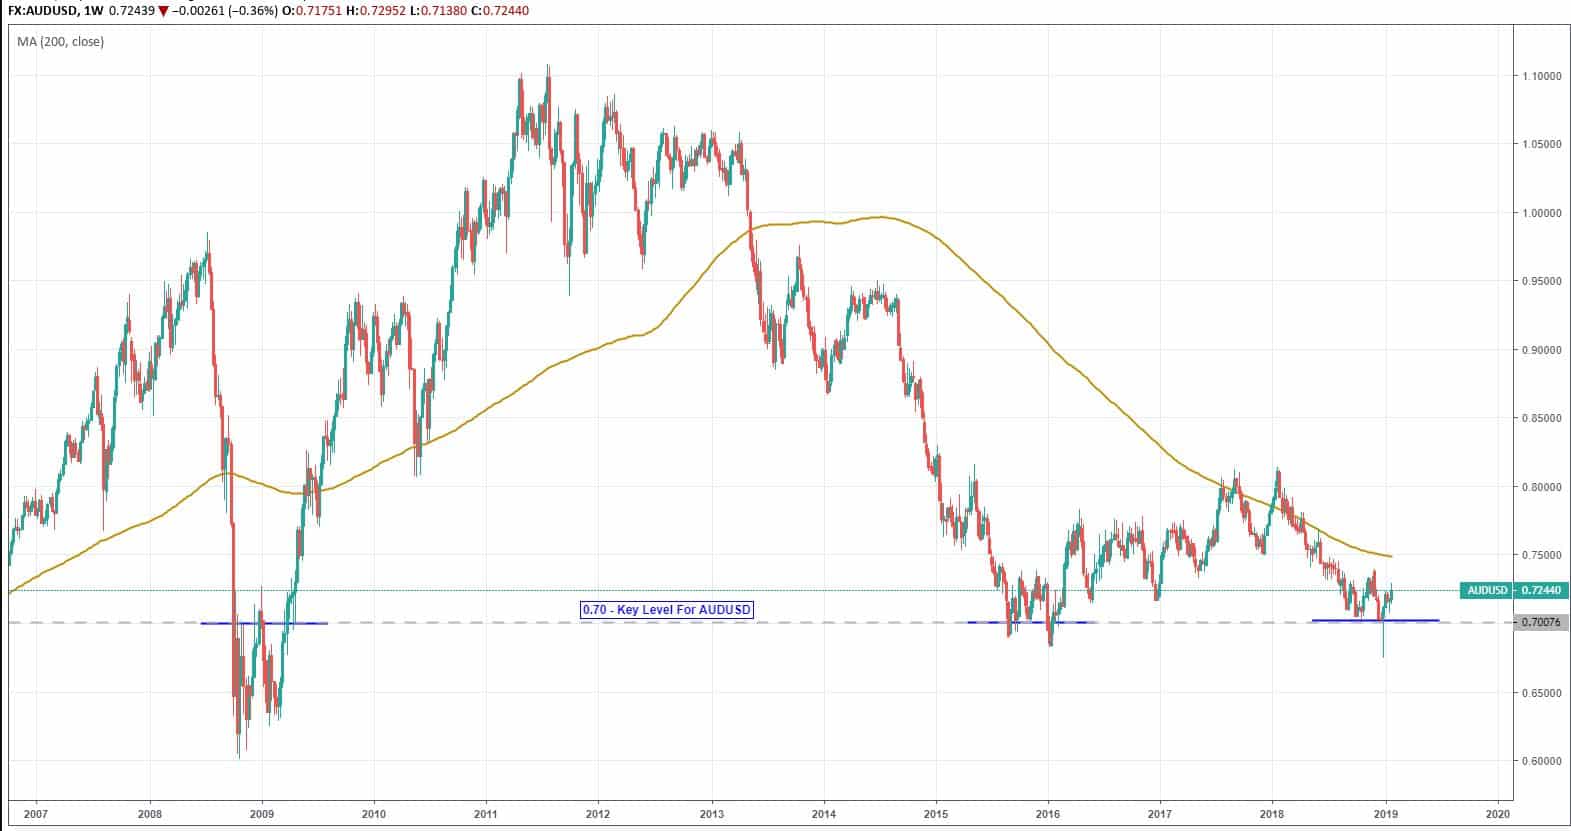
AUDUSD
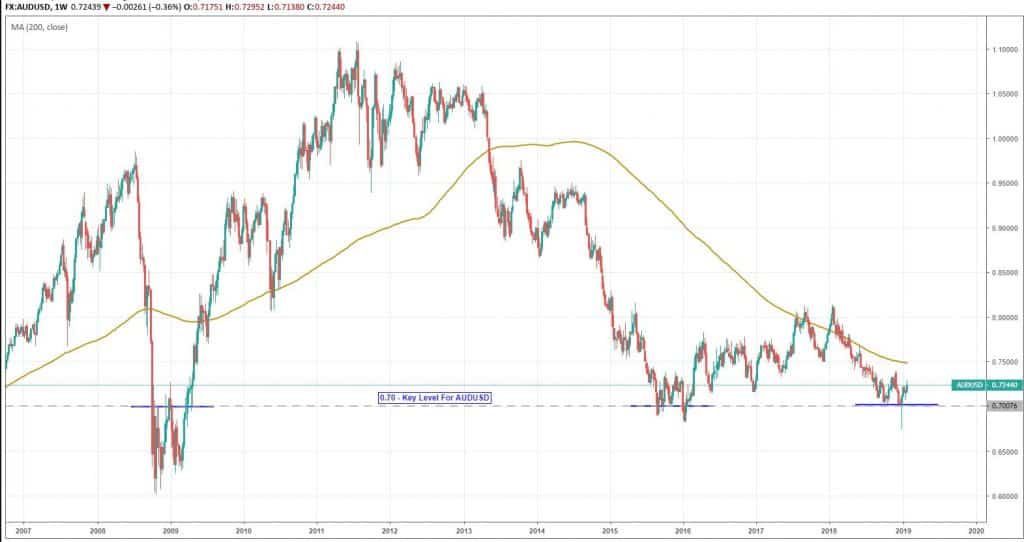
Like a boomerang that’s been thrown and come back, the Aussie has returned to where it began in 2009 following some large swings higher. Currently, in a residual downtrend, it’s difficult to see where this pair may up longer-term, but the key takeaway over the last decade would be the importance of the 0.70 zone regarding support and resistance levels.
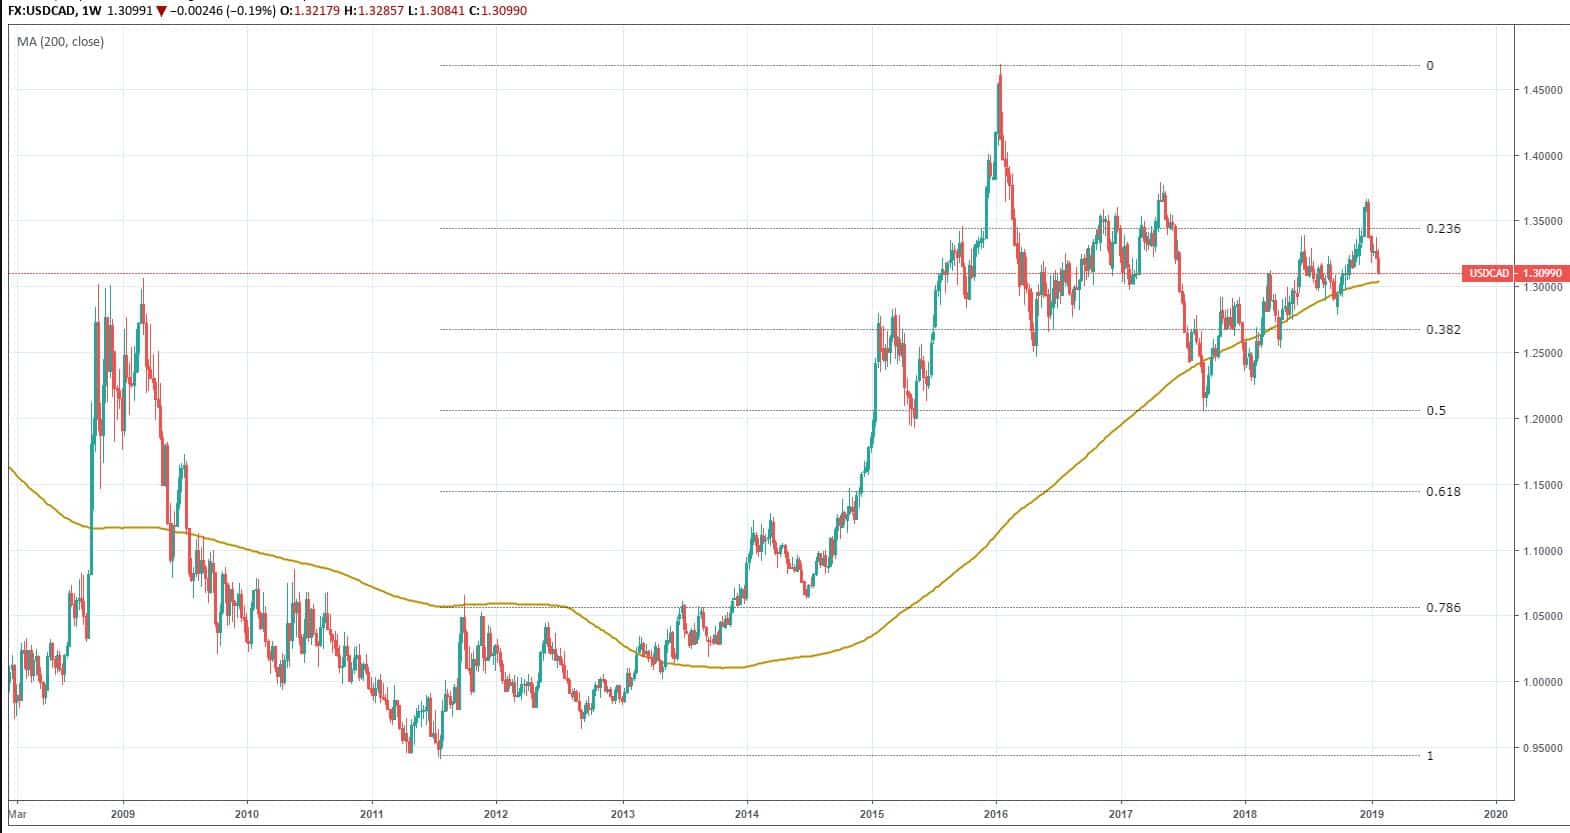
USDCAD
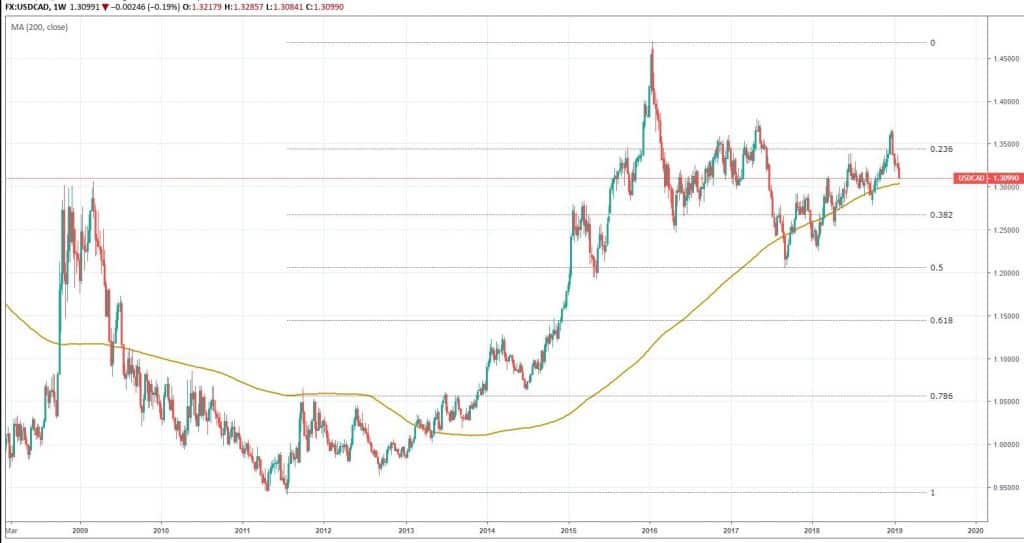
It is also a case of ‘Back To The Future’ for the Loonie. Despite some significant price moves over time, current levels are almost identical to those seen this time ten years ago. Technically still within a longer-term uptrend, price action has maintained a presence around the 200 MA and has produced a textbook series of higher highs and lower lows since mid-2017. It is also worth pointing out that the 50% retracement level near the 1.20 mark has provided strong support for the pair in both 2015 and 2017. The future outlook appears to be indecisive moves heading sideways.
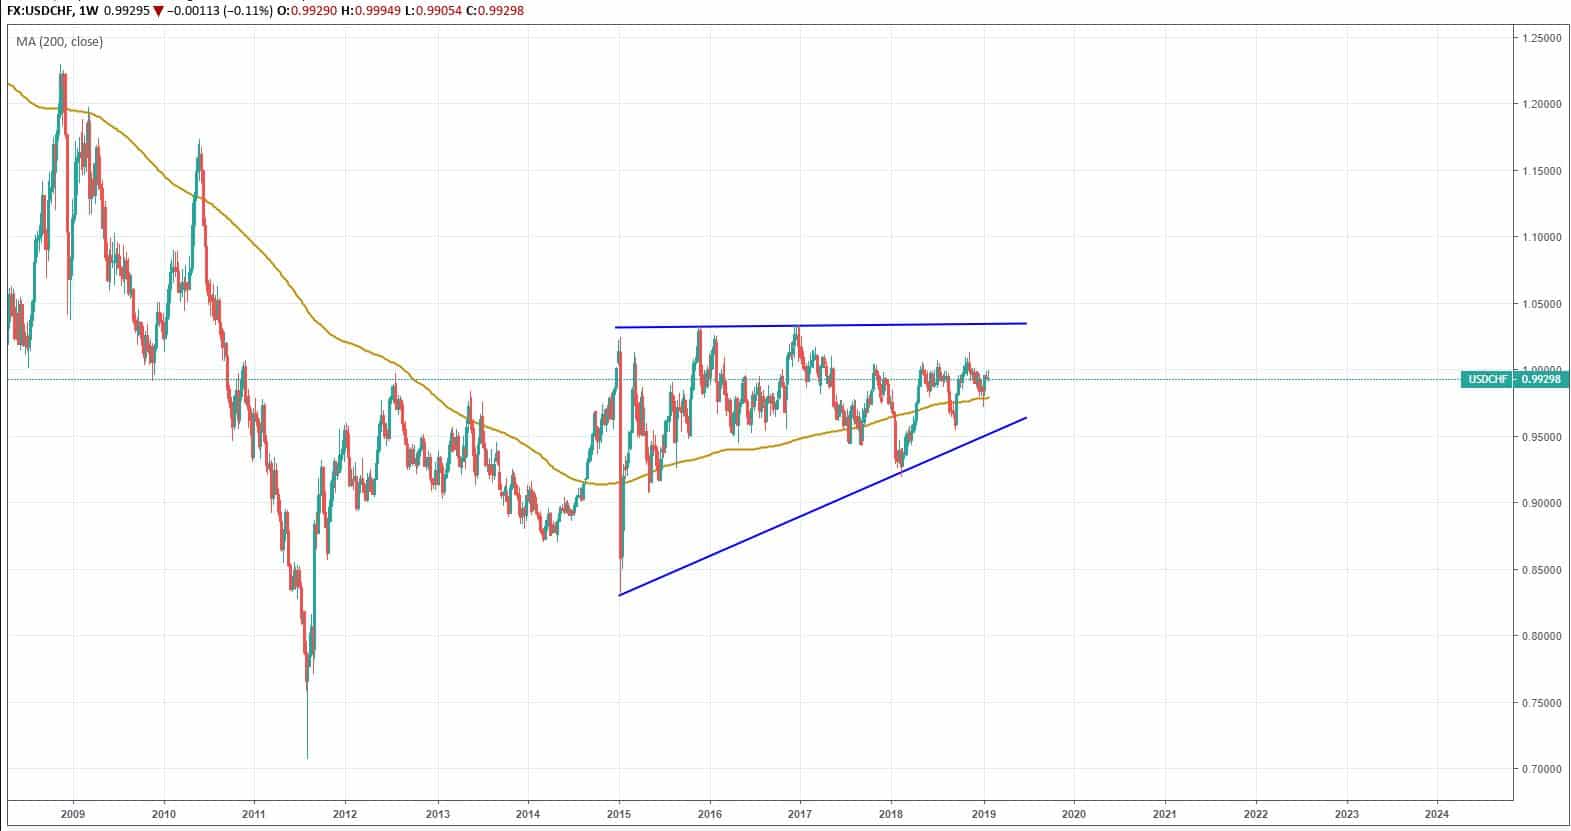
USDCHF
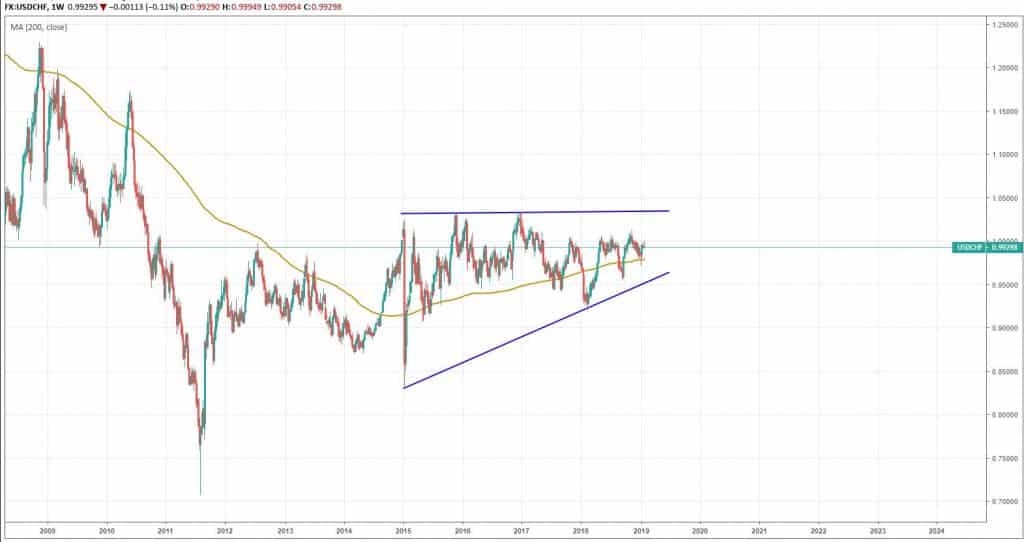
Not too much change for the Swissie either since 2009. Following the SNB crisis in 2015, price action has been practically non-existent with 1.03 acting as somewhat of a ceiling slowly squeezing the price into submission. We could either see a massive breakout after this extended consolidation phase or perhaps more of the same longer-term.
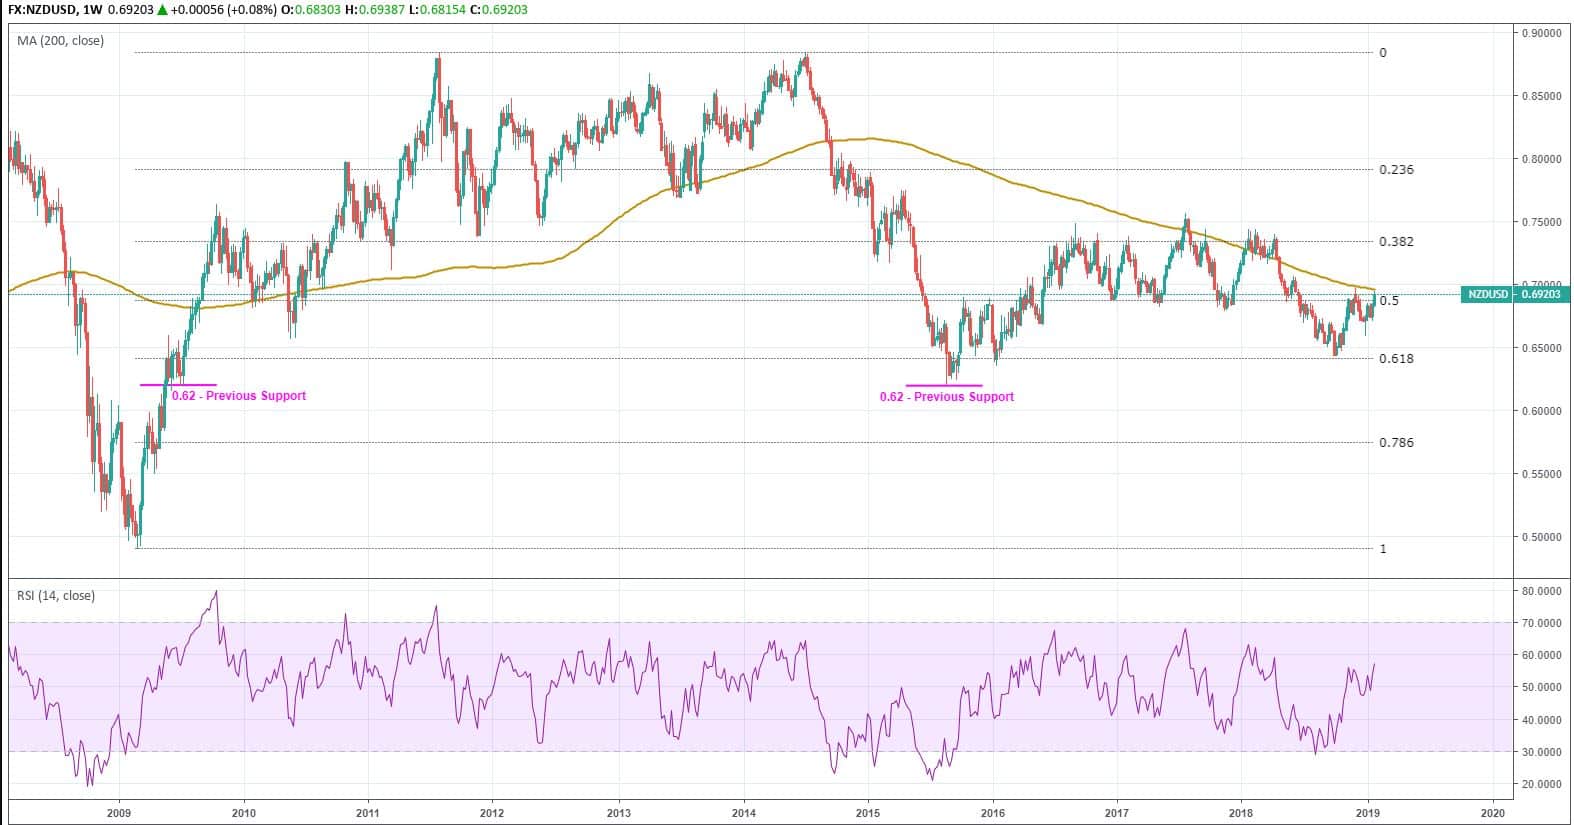
NZDUSD
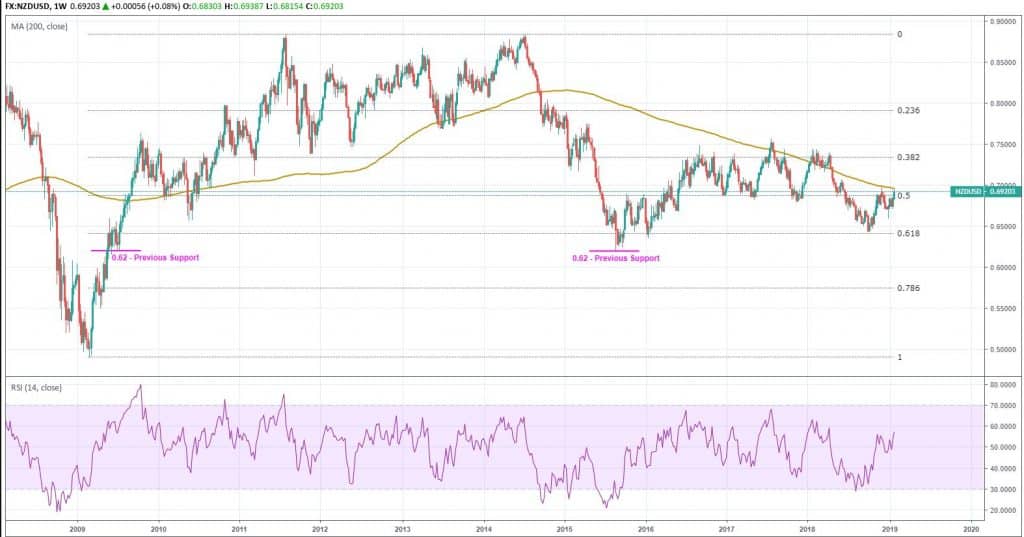
An impressive 36% gain since 2009. Longer-term we have settled around the 50% Fibonacci retracement level of the Jun 2014 high. Current levels also coincide with the 200 Moving Average which price action has failed to break above in recent years convincingly. There is still a slight bias to the downside, and the previous support level of 0.62 could be a potential target should the Kiwi Dollar continue to grind lower.
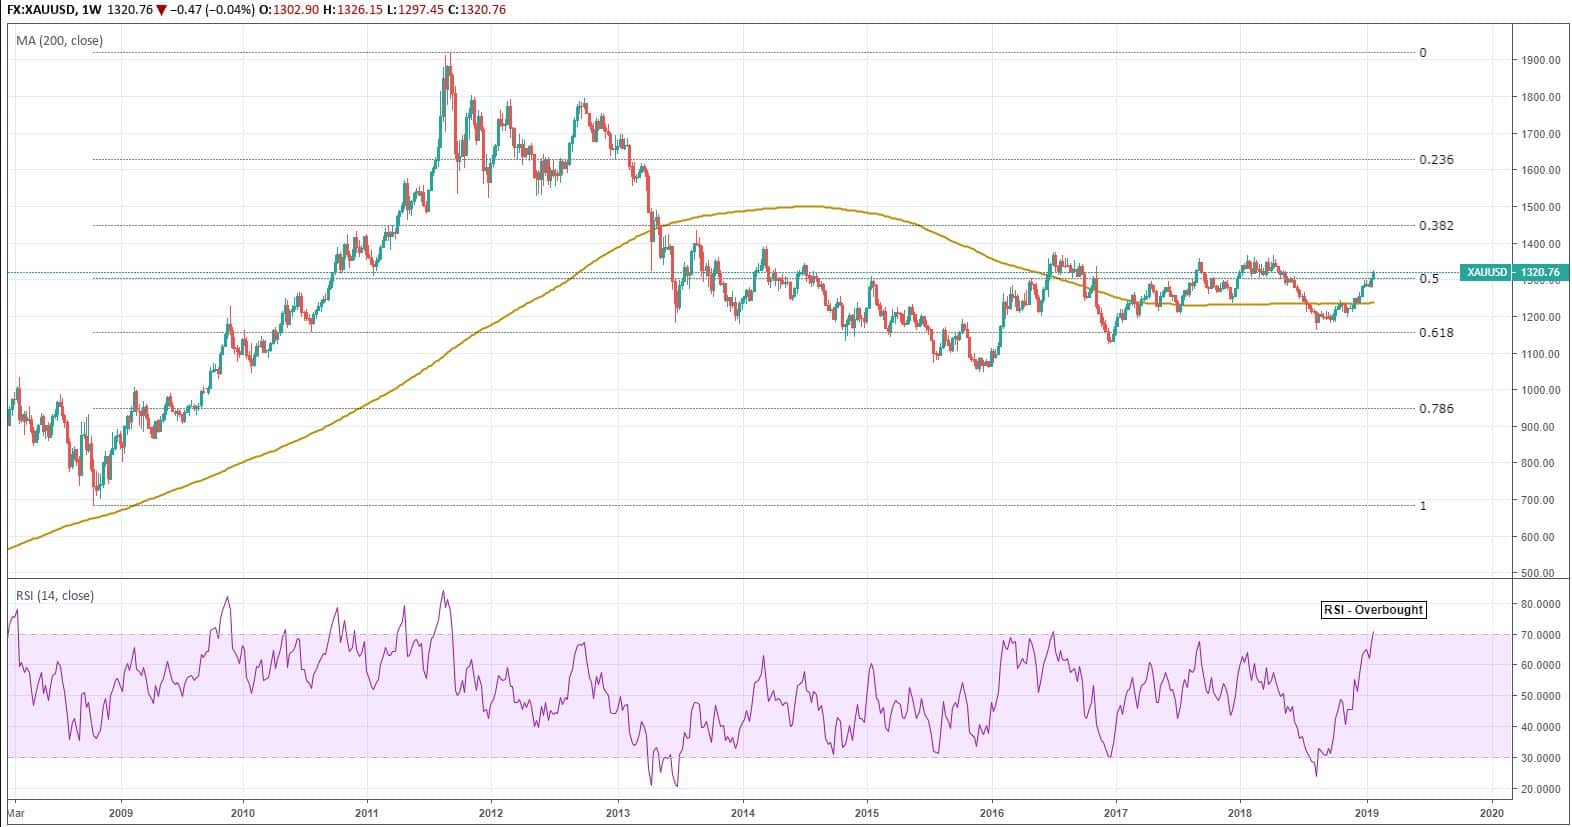
XAUUSD
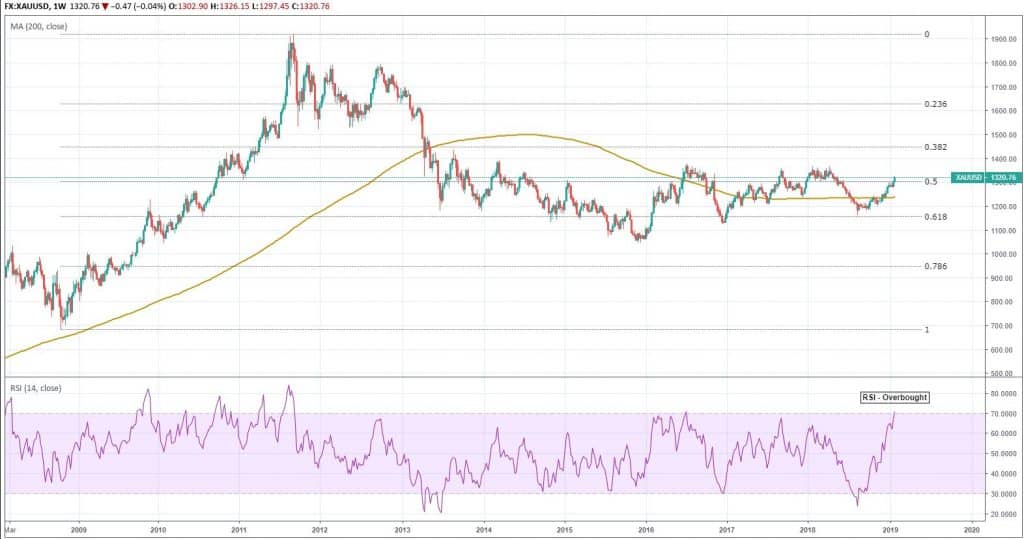
An impressive price rise in the last decade for the precious metal, and similar to Kiwi Dollar, current price action is sitting around the 50% Fibonacci retracement level from the August 2011 high. The overall longer-term trend has been sideways since 2013 with no clear directional bias in sight. The only thing worth noting here is the current RSI situation which appears overbought and could spell some bearish activity in the weeks and months ahead.
This article is written by a GO Markets Analyst and is based on their independent analysis. They remain fully responsible for the views expressed as well as any remaining error or omissions. Trading Forex and Derivatives carries a high level of risk. For more resource on Forex trading check out our Forex Trading For Beginners introduction, Forex Trading Courses, open a Forex Demo Account or open a live Forex Trading Account.
Sources: Go Markets MetaTrader, Google, Datawrapper, Tradingview.
The information provided is of general nature only and does not take into account your personal objectives, financial situations or needs. Before acting on any information provided, you should consider whether the information is suitable for you and your personal circumstances and if necessary, seek appropriate professional advice. All opinions, conclusions, forecasts or recommendations are reasonably held at the time of compilation but are subject to change without notice. Past performance is not an indication of future performance. Go Markets Pty Ltd, ABN 85 081 864 039, AFSL 254963 is a CFD issuer, and trading carries significant risks and is not suitable for everyone. You do not own or have any interest in the rights to the underlying assets. You should consider the appropriateness by reviewing our TMD, FSG, PDS and other CFD legal documents to ensure you understand the risks before you invest in CFDs. These documents are available here.
#Forex #ForexAnalysis #ForexBroker #ForexCharts #ForexMarket #ForexNews #ForexSignal #ForexTradingNext Article
The Royal Commission’s Mammoth Report
The bombshell report of the Royal Commission is finally out. The report depicts how the Banking, Superannuation and Insurance industries have treated their customers and employees. It highlights the expectations that customers should be compensated, while also addressing the need for financial services that break the law to be held accountab...
February 5, 2019Read More >Previous Article
Australian Banking Industry
Australian Banking Industry The final report of the Royal Commission will be released just after the Australian market closes at around 4 PM! H...
February 4, 2019Read More >
- Trading
- Trading
- Trading
- Markets
- Markets
- Products overview
- Forex
- Commodities
- Metals
- Indices
- Shares
- Cryptocurrencies
- Treasuries
- Platforms
- Platforms
- Platforms
- Platforms
- Platforms overview
- MetaTrader 4
- MetaTrader 5
- Education
- Education
- Education
- Education
- News & analysis
- Education Hub
- Economic calendar
- Help & support
- Help & support
- About